Enabling Rule Simulation for Transaction Monitoring
- When
- Duration
- 4 weeks
- Platform
- Desktop Web App
- Company
- ComplyAdvantage
Context
As part of building Mesh, our new unified AML risk detection platform, we identified a major gap inherited from our legacy transaction monitoring product: clients had no reliable way to test or validate rule changes before applying them to production.
In the legacy system, testing a rule required exporting production data, importing it into a sandbox environment, manually modifying configurations, running simulations, and then exporting the results again to analyse them externally in spreadsheets. This process was slow, error-prone, and created friction between clients and our implementation team, who were often asked to make rule changes on their behalf.
Given the regulatory sensitivity of transaction monitoring and the operational cost of false positives, our goal was to design a self-serve rule simulation experience within Mesh that would allow compliance teams to confidently test, compare, and fine-tune their rules using real historical data, without impacting production alerts.
Problem
Heads of compliance and financial crime managers need to answer the following:
If we change this rule, what will actually happen?
In practice, this question is difficult to answer because:
- Rule performance is often measured indirectly (e.g. SAR filings instead of actual losses to measure true positive)
- False positives are hard to estimate
- Our legacy tool don’t allow testing against real production data
- Results lack context, making them hard to justify internally or to regulators
Without a clear way to simulate outcomes, rule changes become risky decisions rather than informed ones.
Objective
Design a self-serve simulation environment that allows clients to optimise and make changes to their transaction monitoring rules with confidence.
My role
- I led the end-to-end product design for rule simulation in Mesh
- I partnered closely with the product manager to define scope and sequencing
- I led discovery interviews with existing clients
- I designed and iterated on interaction models, data visualisation, and comparison mechanics
- I collaborated closely with engineering to understand the underlying rule processing architecture
Research
How rule testing actually happens today
Before exploring solutions, I focused on understanding how rule testing is currently performed inside client organisations. Early discovery showed that for most teams, testing is not a formalised or continuous process. Rule reviews happen on very different cadences depending on the institution: some teams review rules monthly, others annually, and many only reactively during sudden spikes in alert volumes.
Across these setups, testing is rarely embedded into the transaction monitoring tooling itself. Instead, it exists as a loose collection of workarounds: exporting data, running ad-hoc analyses, and manually tracking changes. This fragmentation creates long feedback loops and discourages experimentation. Even when teams suspect a rule could be improved, the cost of validating that change often outweighs the perceived benefit. This reframed the problem early on: rule testing wasn’t just missing functionality but an unreliable workflow.
Understanding current practices
On top of that, we interviewed existing clients who actively manage transaction monitoring rules. Rather than focusing on desired features, the interviews centred on how users evaluate rule performance and make decisions about change.
Several patterns emerged consistently. The lack of self-serve testing capabilities leads to frequent back-and-forth with our implementation team, slowing iteration and limiting autonomy. Users also expressed a strong need to test their rules against production data to ensure real conditions testing. Finally, simulation results are routinely exported into spreadsheets to create custom charts and reports, because existing tools do not support comparison or storytelling.
Across interviews, it became clear that users spend significant time explaining and justifying tuning decisions internally and to regulators, often relying on screenshots, spreadsheets, and manually written summaries. Versioning is handled informally, and comparisons between past and current configurations are usually reconstructed after the fact.
Exploring testing methodologies and constraints
I explored the different testing methodologies used in transaction monitoring and how they are applied in practice. This included backtesting on historical datasets, above-the-line and below-the-line testing to evaluate threshold sensitivity, and the use of synthetic data to simulate known typologies. While these approaches are well understood conceptually, they are rarely supported holistically within existing tools.
A recurring limitation surfaced during this exploration: most clients want to test rules against production data, yet this is often technically or operationally complicated due to tooling constraints. As a result, teams manually export data to import it into a sandbox environment where alerts can be safely generated. While this avoids direct production risk, the process is slow, brittle, and heavily dependent on operational support. At the same time, performance is often assessed using imperfect indicators: some clients equate “true positives” with SAR filings, despite knowing this is an incomplete measure of rule effectiveness.
Synthesising insights into design direction
Research and client interviews led to a clear conclusion: the core problem wasn’t just testing rules, it was making rule performance legible and explainable. Users need to understand what changed, how it affected alerts, and whether the outcome can be confidently defended to auditors and regulators.
This insight shaped the design direction significantly. Rule testing needed to be safe, self-serve, and reversible. Results needed to be comparable across versions, not viewed in isolation. And the system needed to support both high-level impact assessment and detailed inspection of underlying alerts. Rather than treating testing as a background or technical task, the research positioned it as a decision-making space, which builds confidence and turns it into an auditable, repeatable practice.
Concept explorations
Data visualisation & metrics
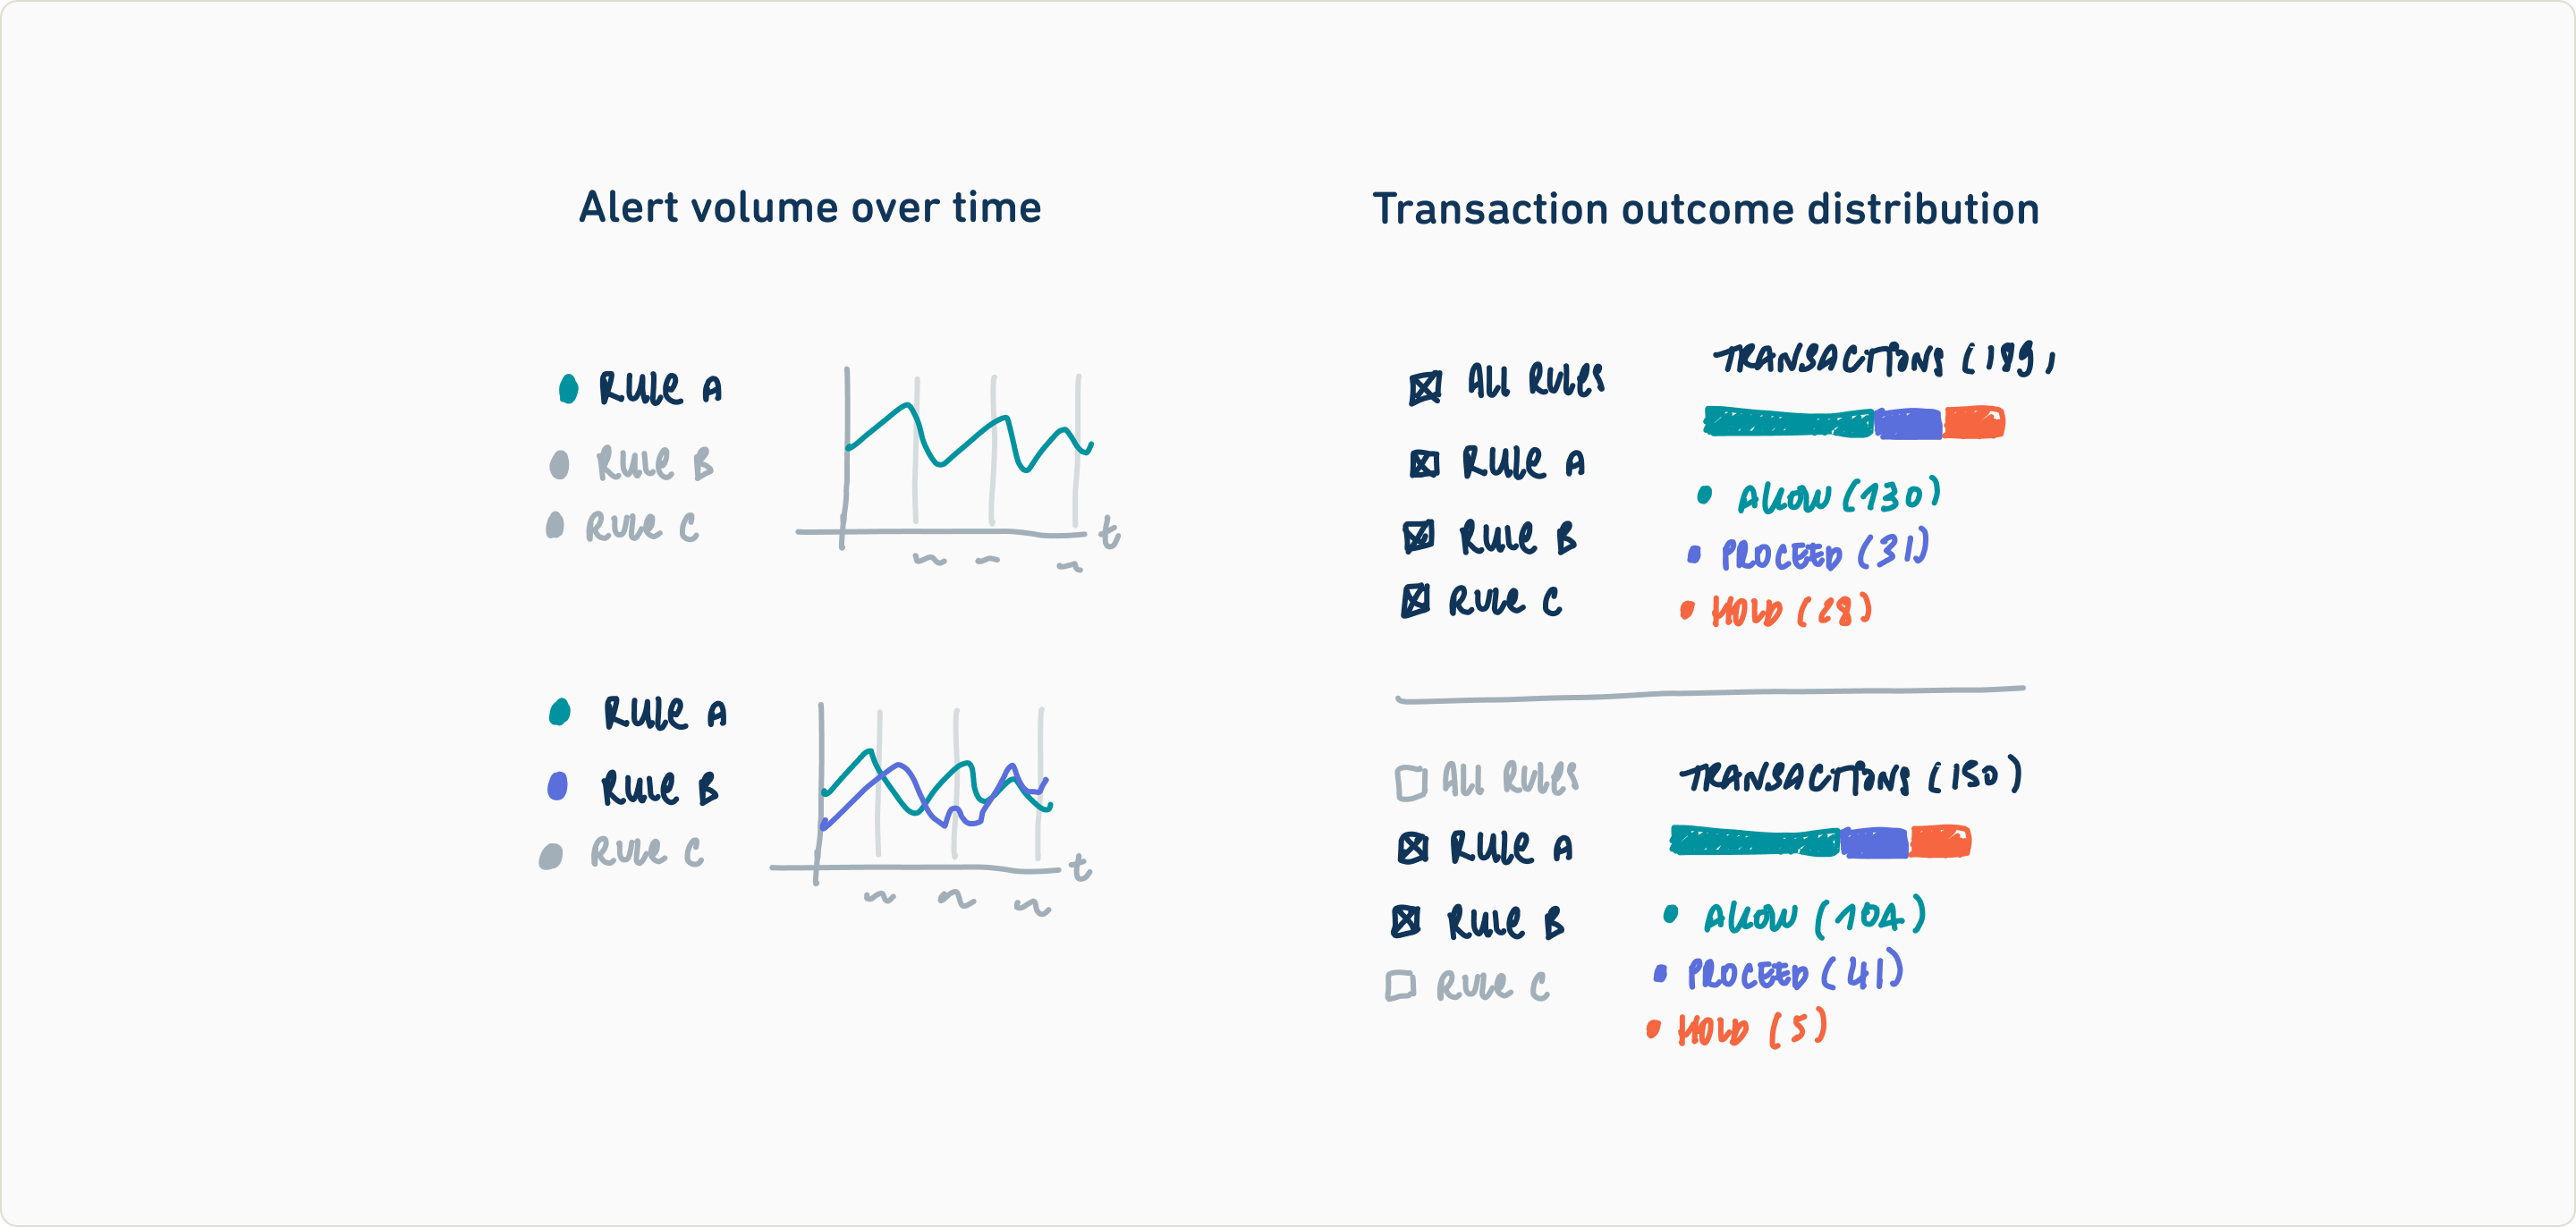
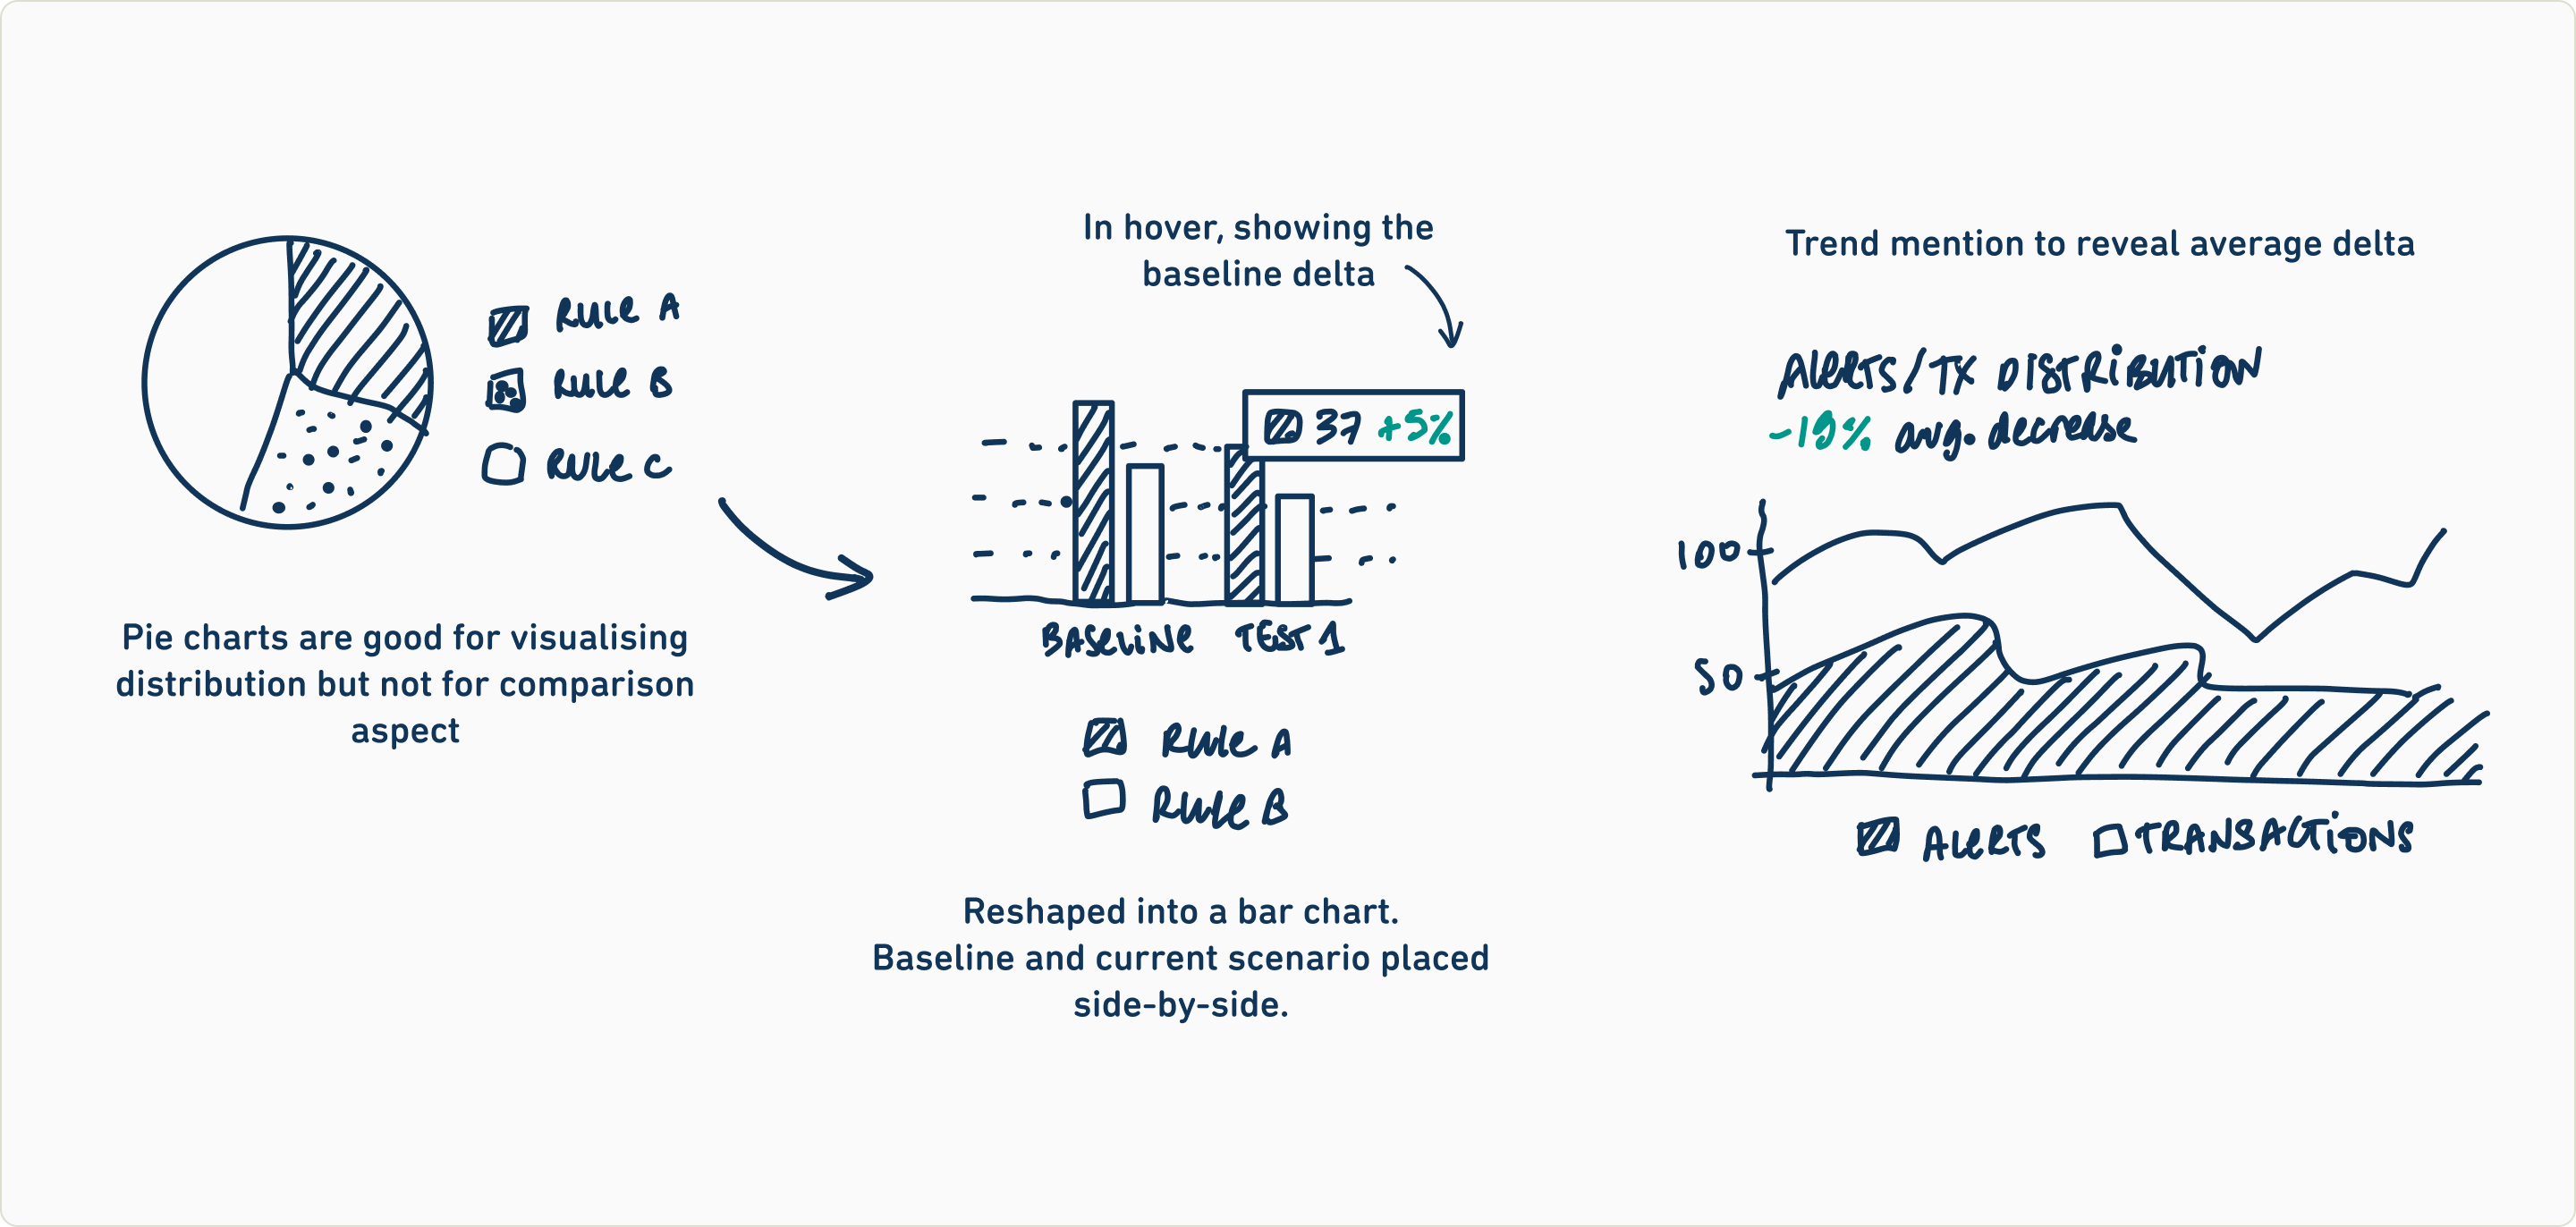
One of the most critical areas to explore was how to surface complex simulation data in a way that allows users to meaningfully compare metrics across different rules and configurations.
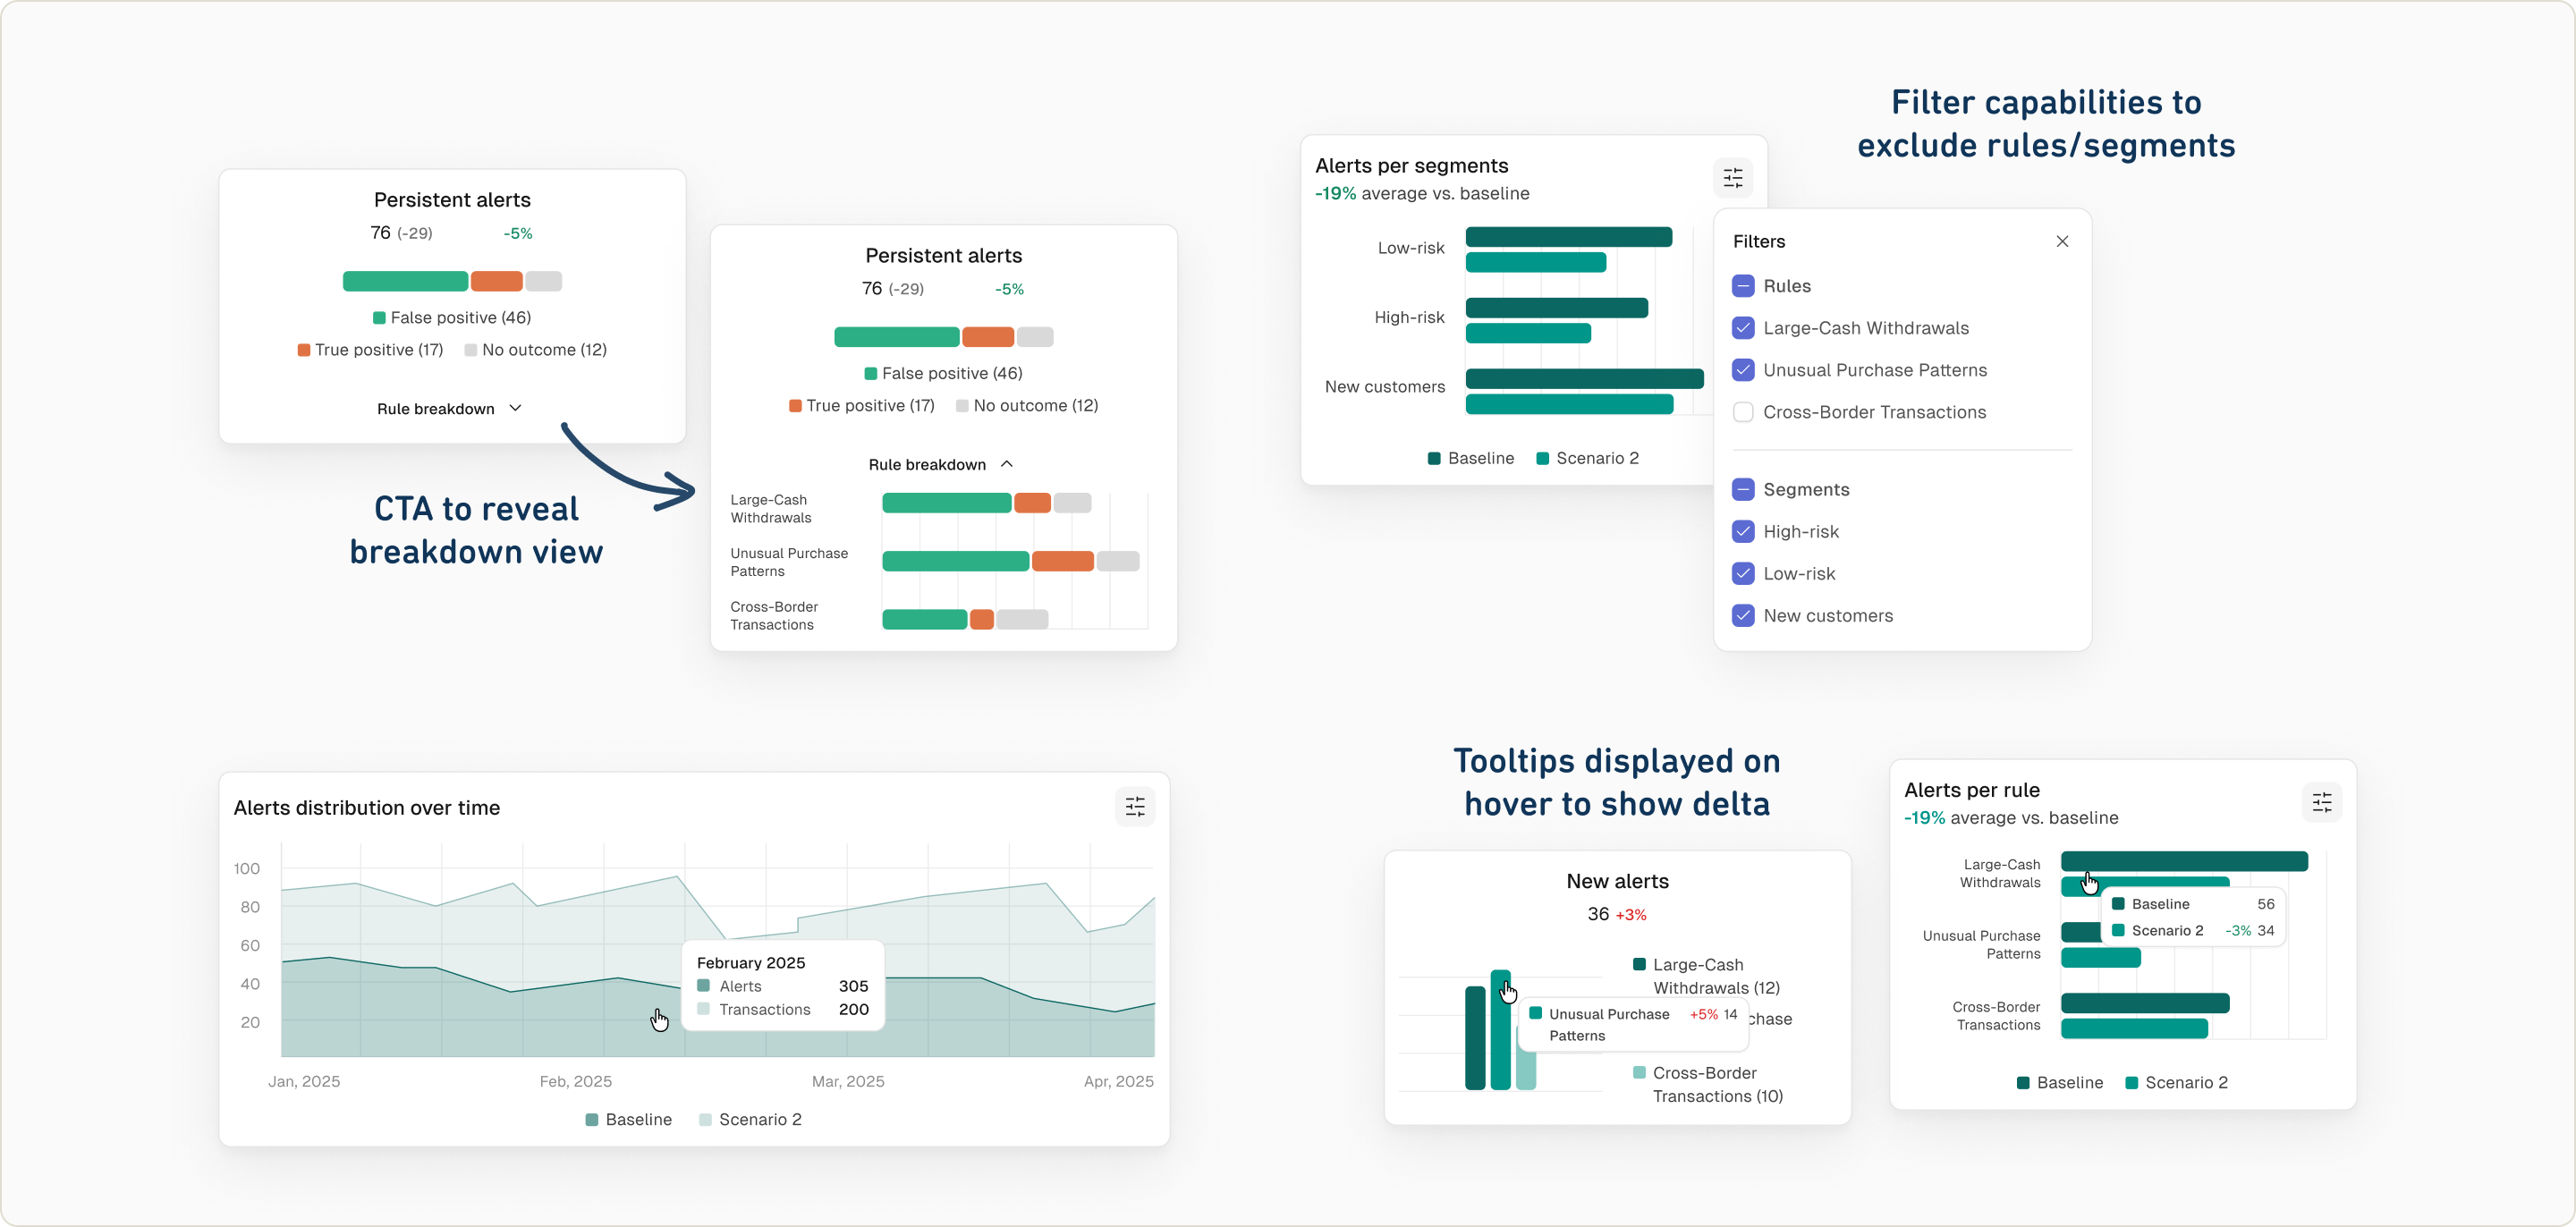
As part of this exploration, I investigated filtering mechanisms that give users direct control over what they see, such as including or excluding specific rules or segments from a visualisation, all without leaving the current view. The goal was to keep the experience focused and fluid, enabling nuanced comparisons within a single, unified page.
Comparison visualisation
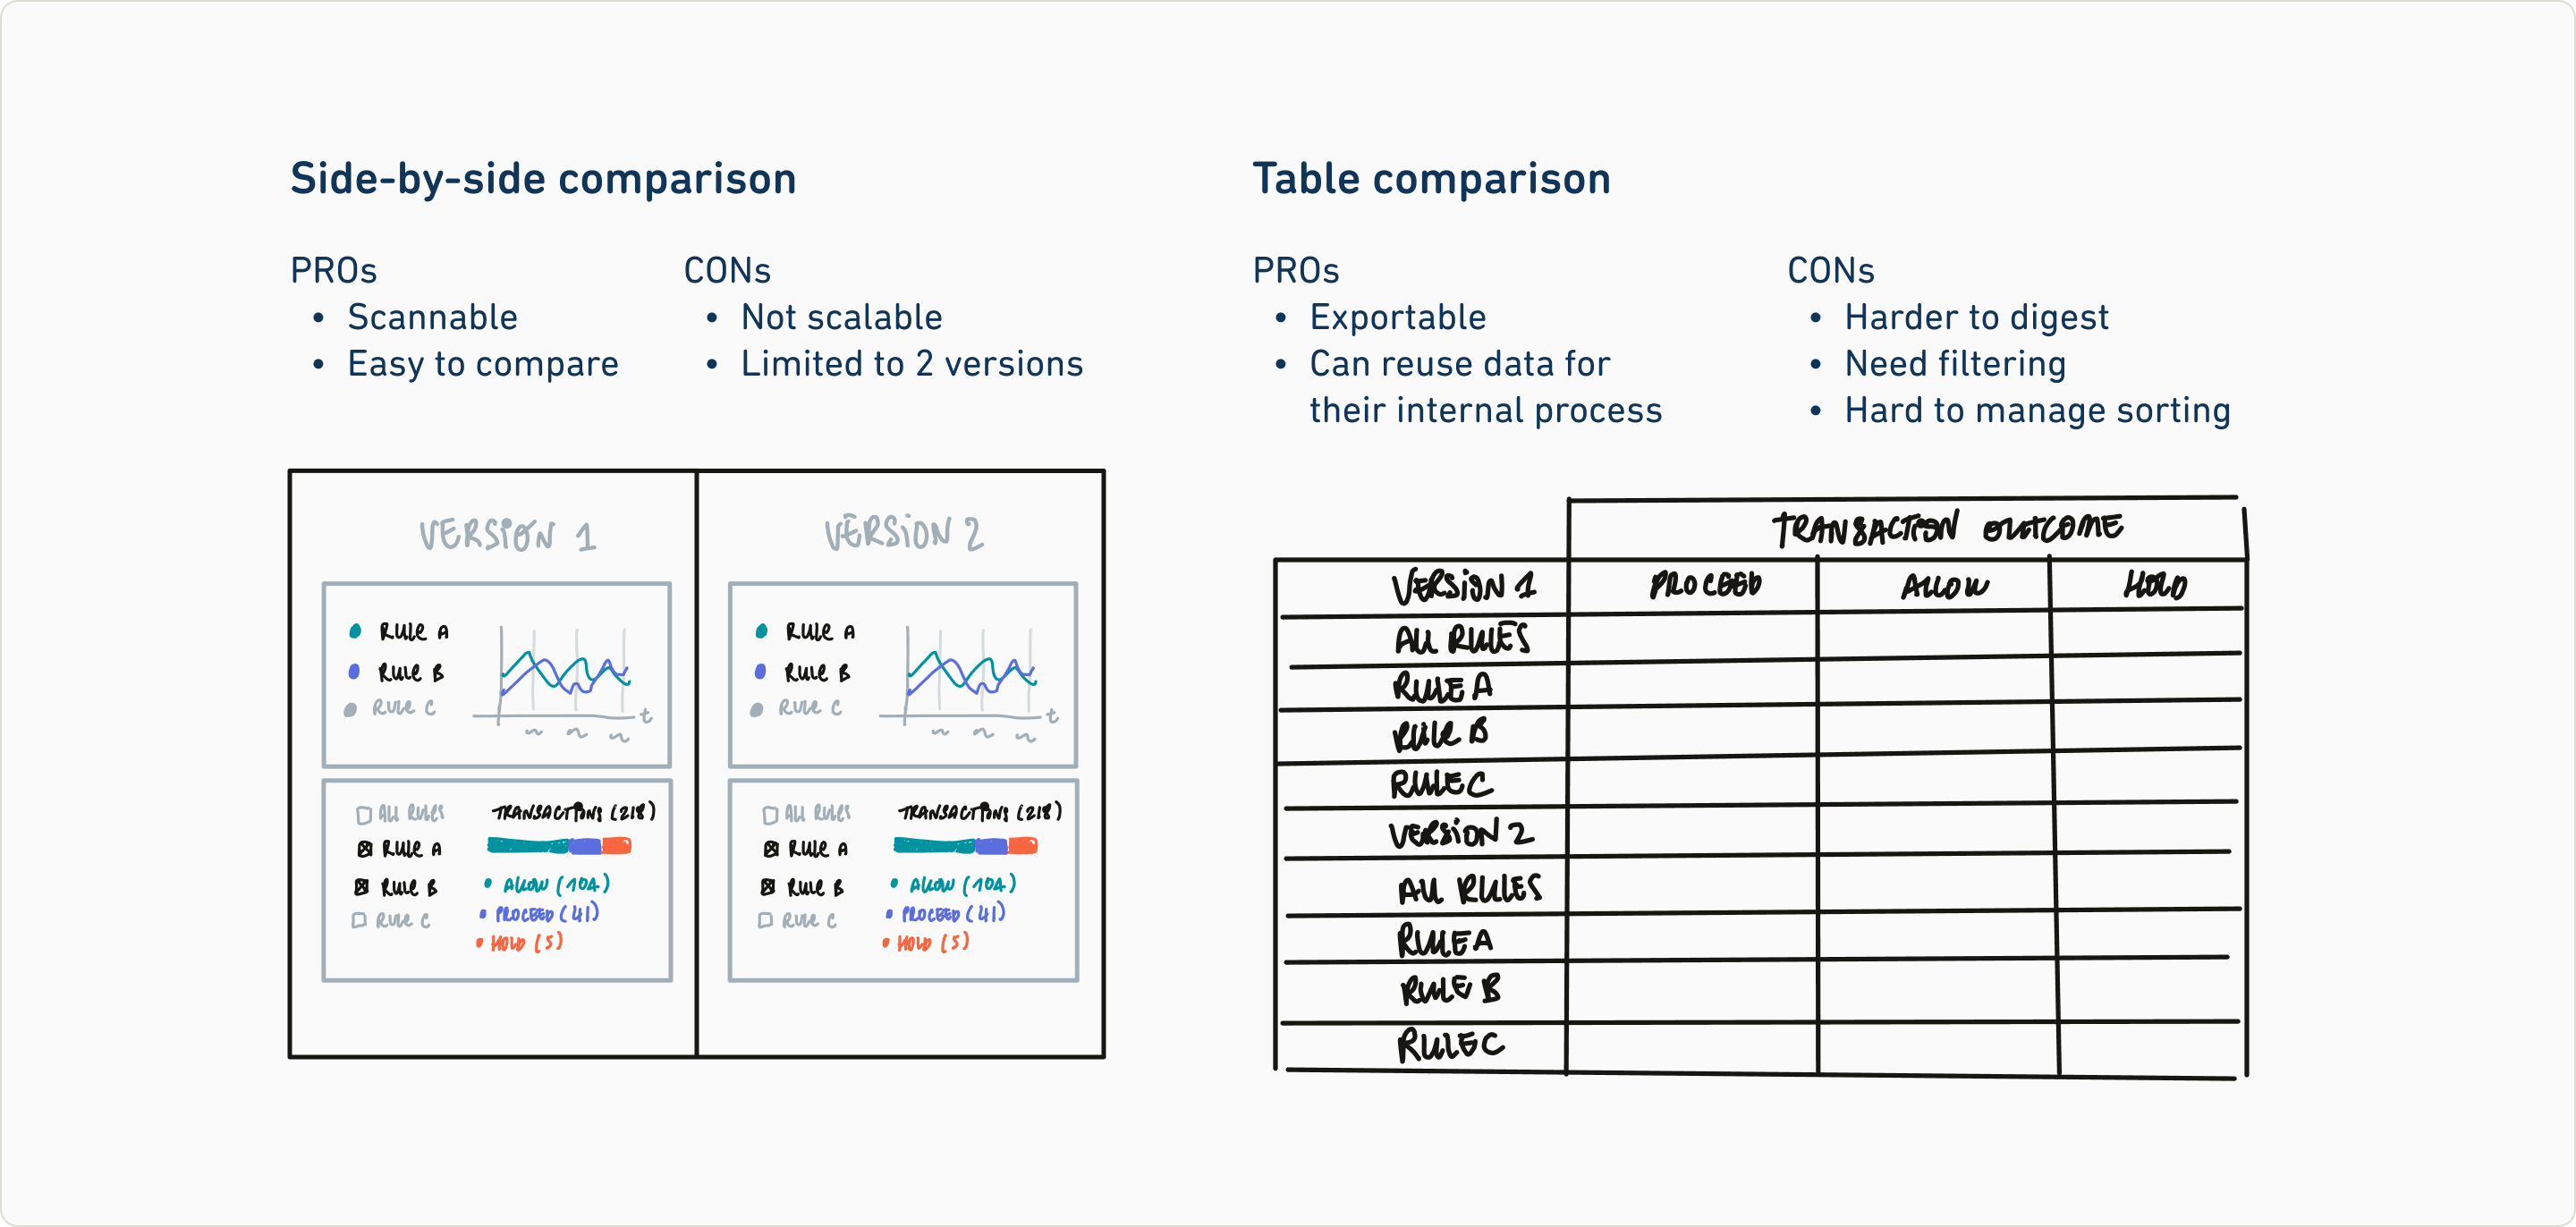
To support decision-making, I’ve explored two approaches for comparing simulation results.
The first one is a side-by-side comparison, where metrics for two simulation variants are placed in parallel. This approach is highly scannable and makes it easy to visually compare key metrics across versions at a glance. Its main limitation, however, is scalability, it works best when comparing only two versions, but adding more would quickly overwhelm the interface.
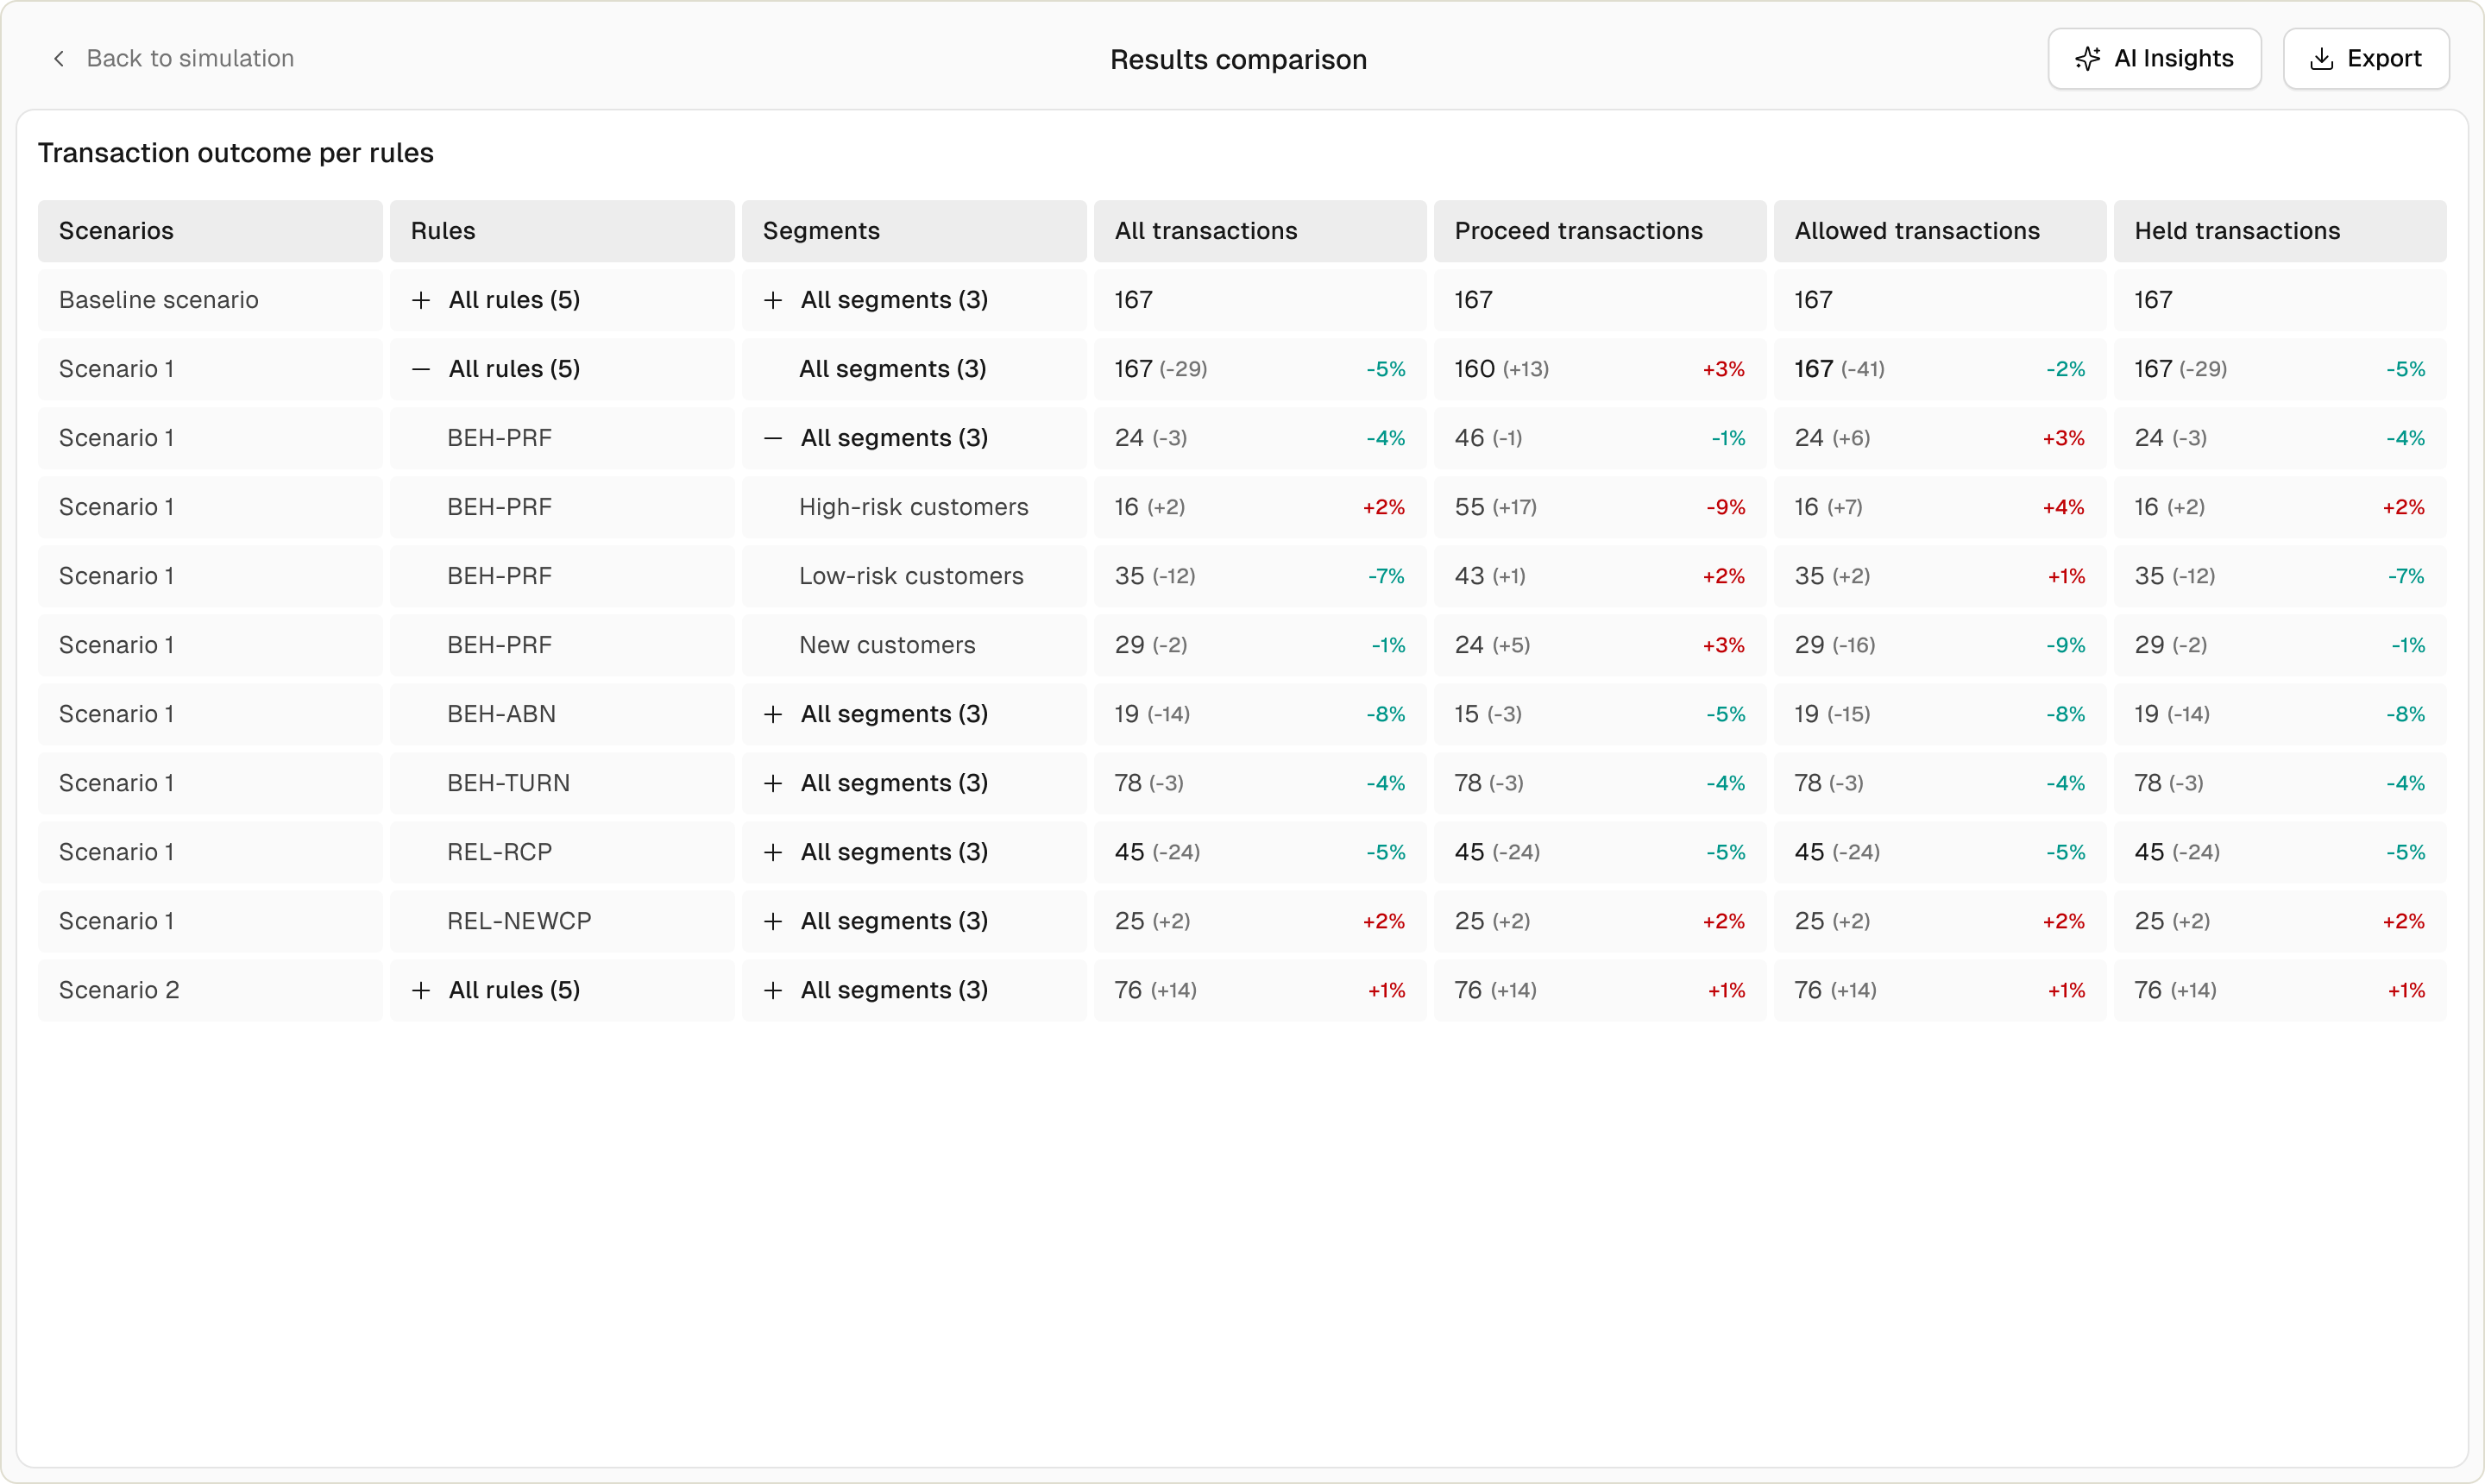
The second is a table-based comparison, here specifically representing transaction outcomes distribution. This format is exportable and allows users to reuse the data in their internal processes, making it ideal for comparisons involving more than two simulation variations. The trade-offs are that it can be harder to digest visually, requires filtering for clarity, and needs careful management of sorting to stay usable.
Both methods proved valid, but their respective strengths guided later decisions: side-by-side for quick qualitative insights and table comparison for deeper quantitative analysis.
High-fidelity designs
Creating a simulation
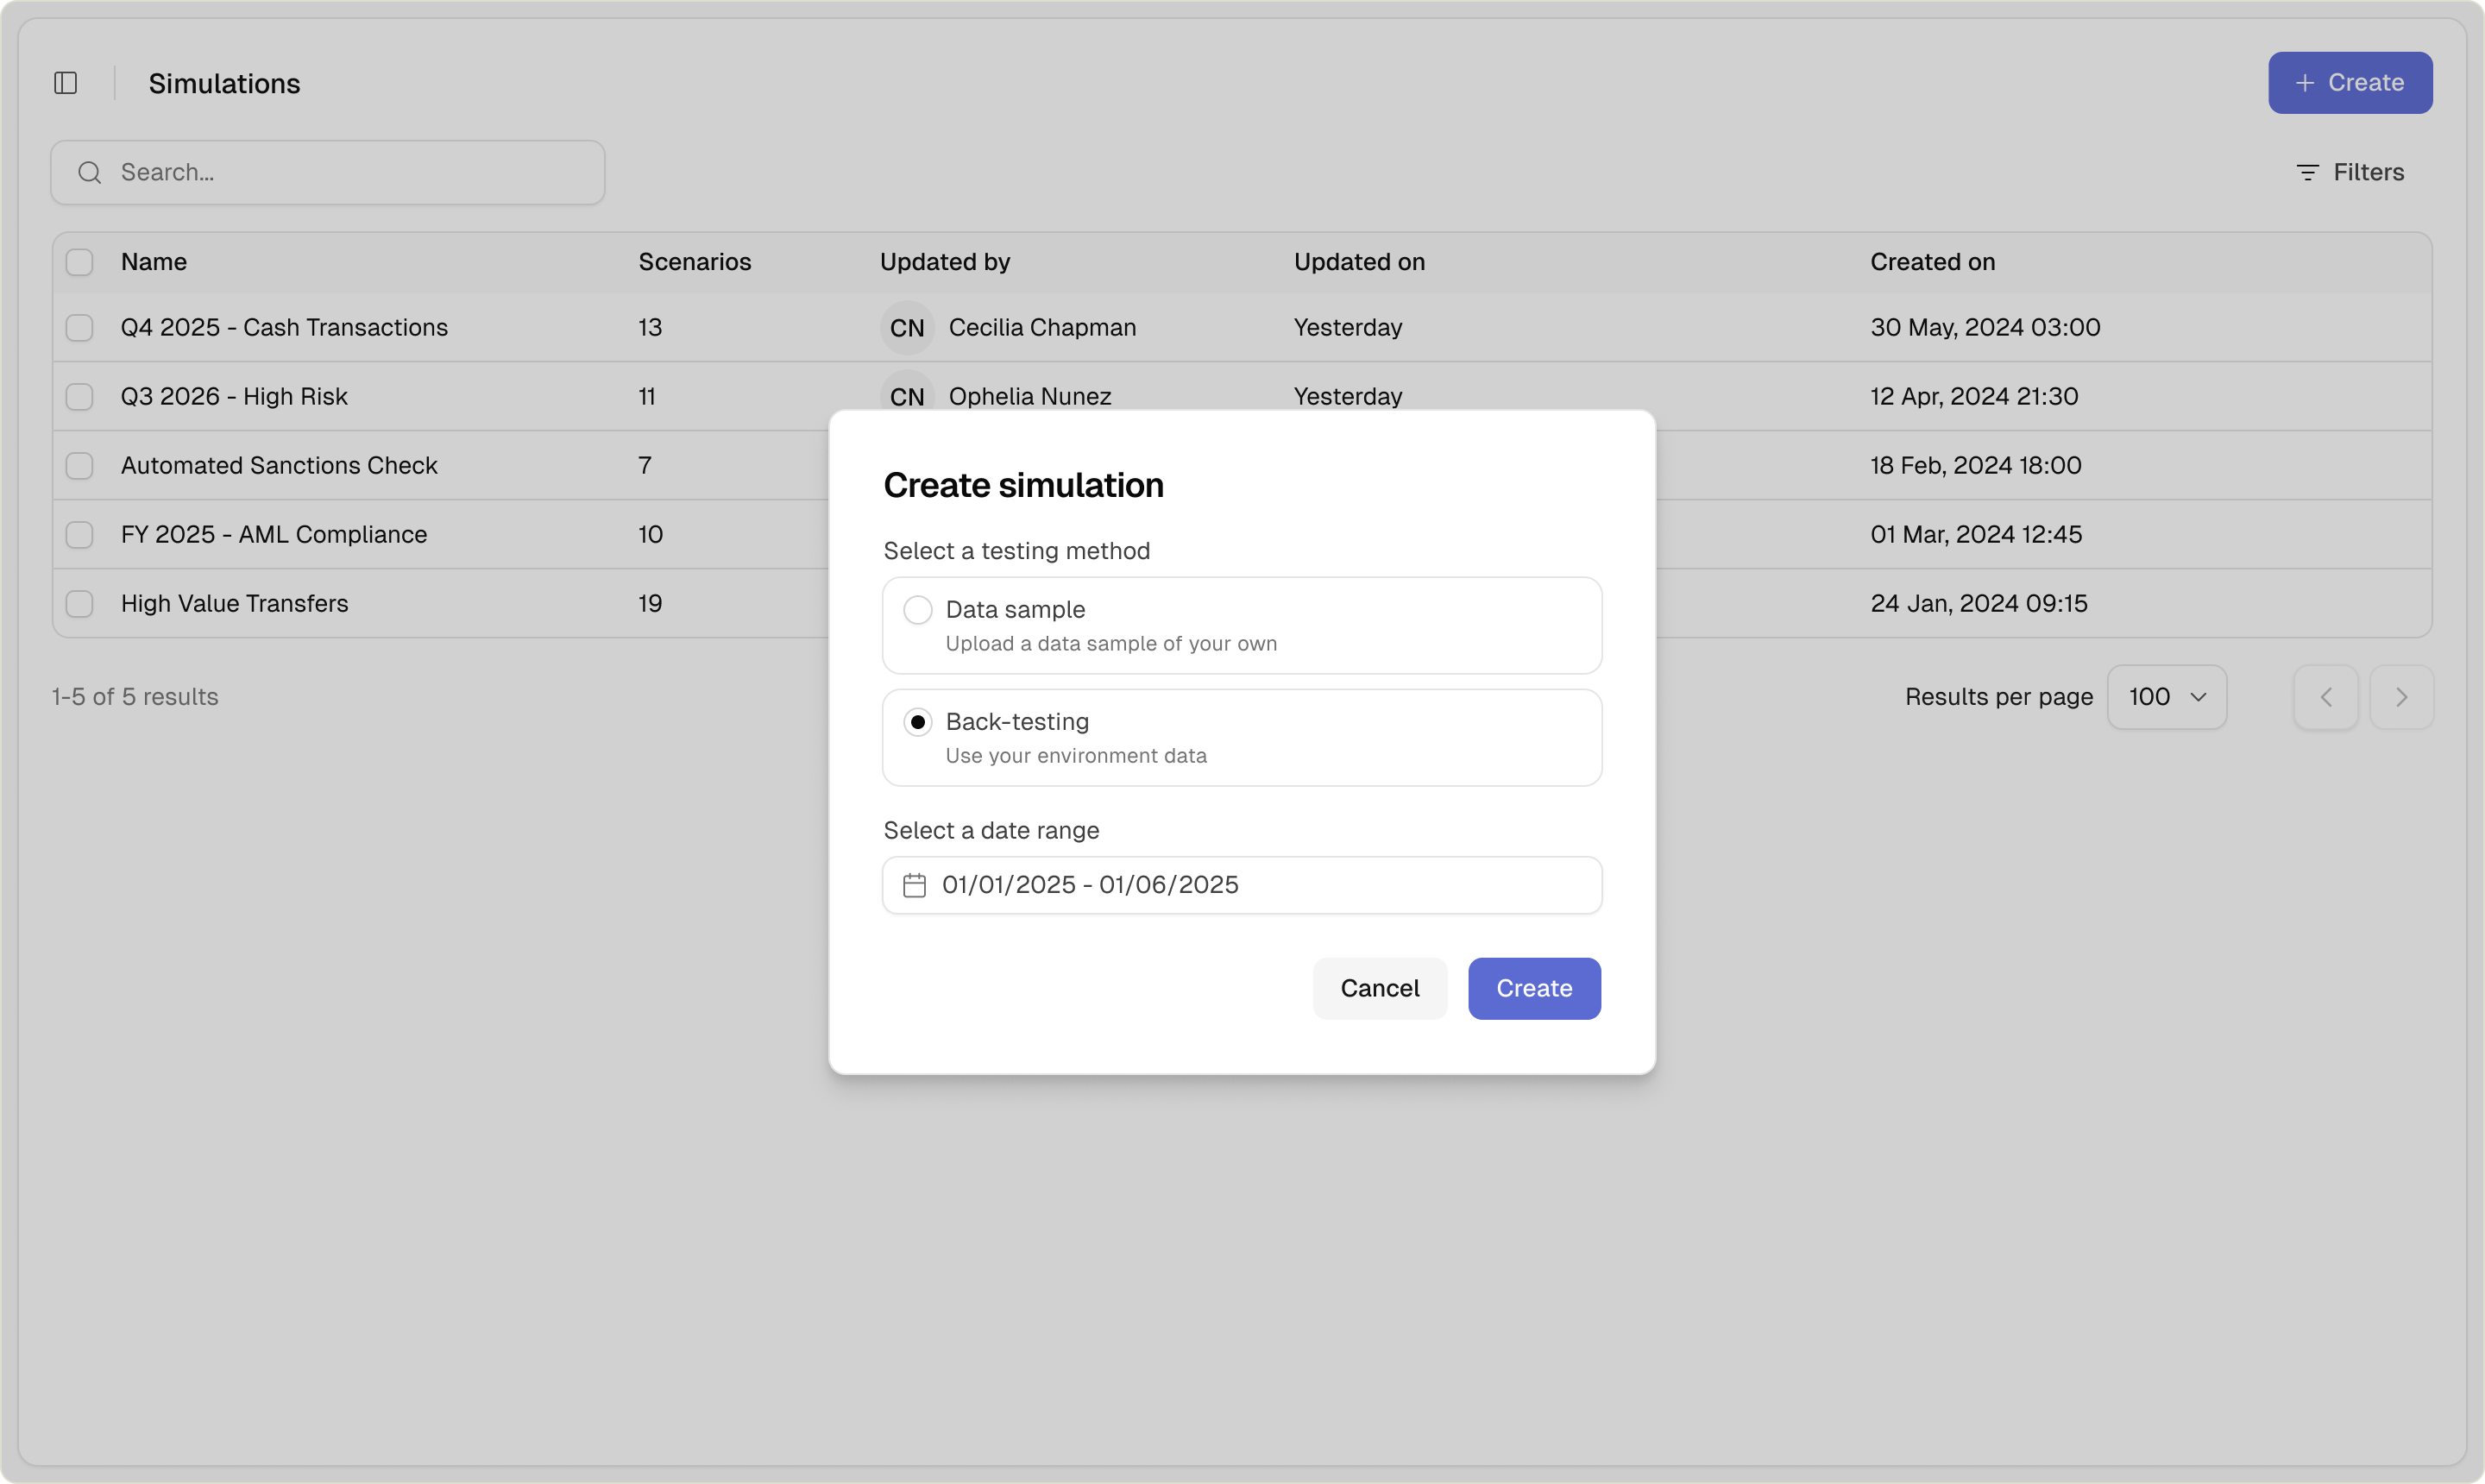
Testing begins in the ‘Simulations list’ page where users can see all previously created simulations. This page serves two purposes: it provides historical visibility across past experiments and it acts as the entry point to create a new simulation.
During the creation of a new simulation, users must first choose between two methodologies:
- Data sample upload, for controlled or synthetic testing
- Backtesting, using historical transaction data from their account
This distinction was important: rule tuning can be exploratory or validation-driven, and the system can support both. For backtesting, users define a historical date range to make the scope of the experiment explicit.
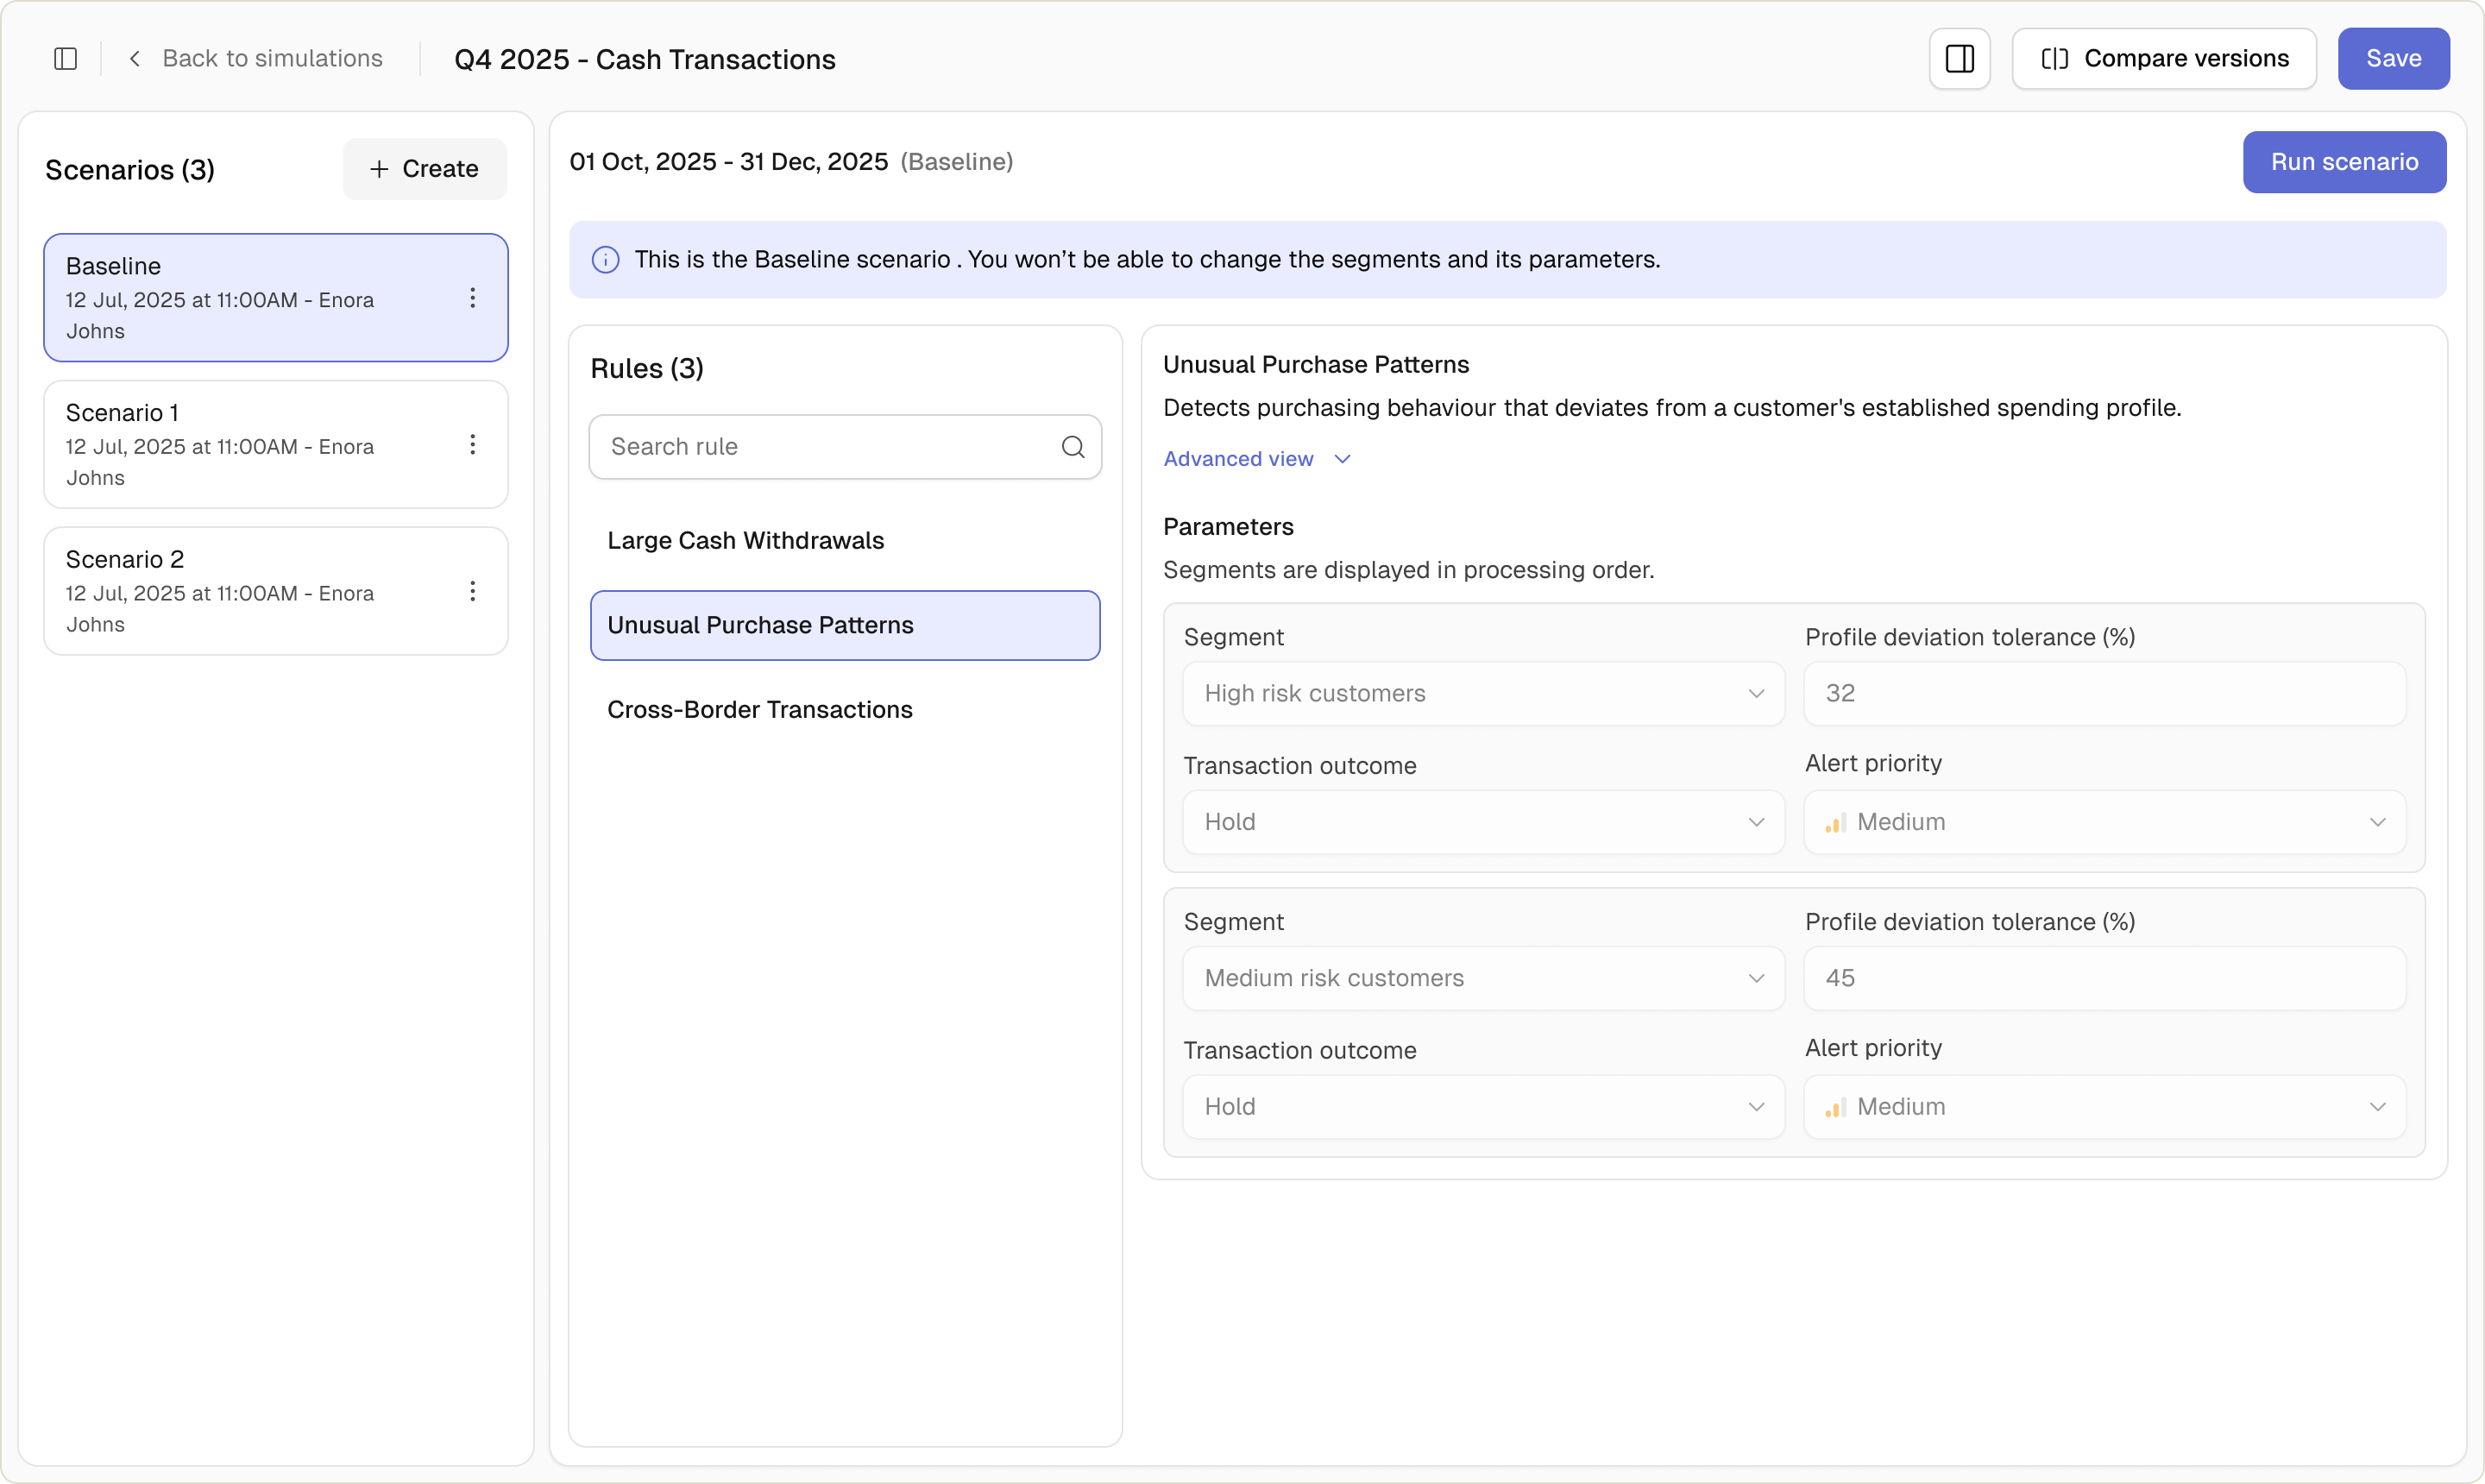
The reference test to establishing a baseline
Each simulation is designed as a workspace that can host multiple tests. This allows users to run several variations within the same simulation context and compare their performance metrics.
By default, when a simulation is created, no custom tests exist. The only test automatically generated is the reference test. Users can add rules they wish to include, but its configuration, such as segments and parameters, cannot be edited. This one acts as the analytical baseline for the entire simulation. It represents the initial configuration state and provides a stable anchor against which all subsequent tests can be evaluated.
Instead of running disconnected simulations, users operate within a structured workspace: a simulation contains one fixed reference baseline and multiple variation tests for comparison.
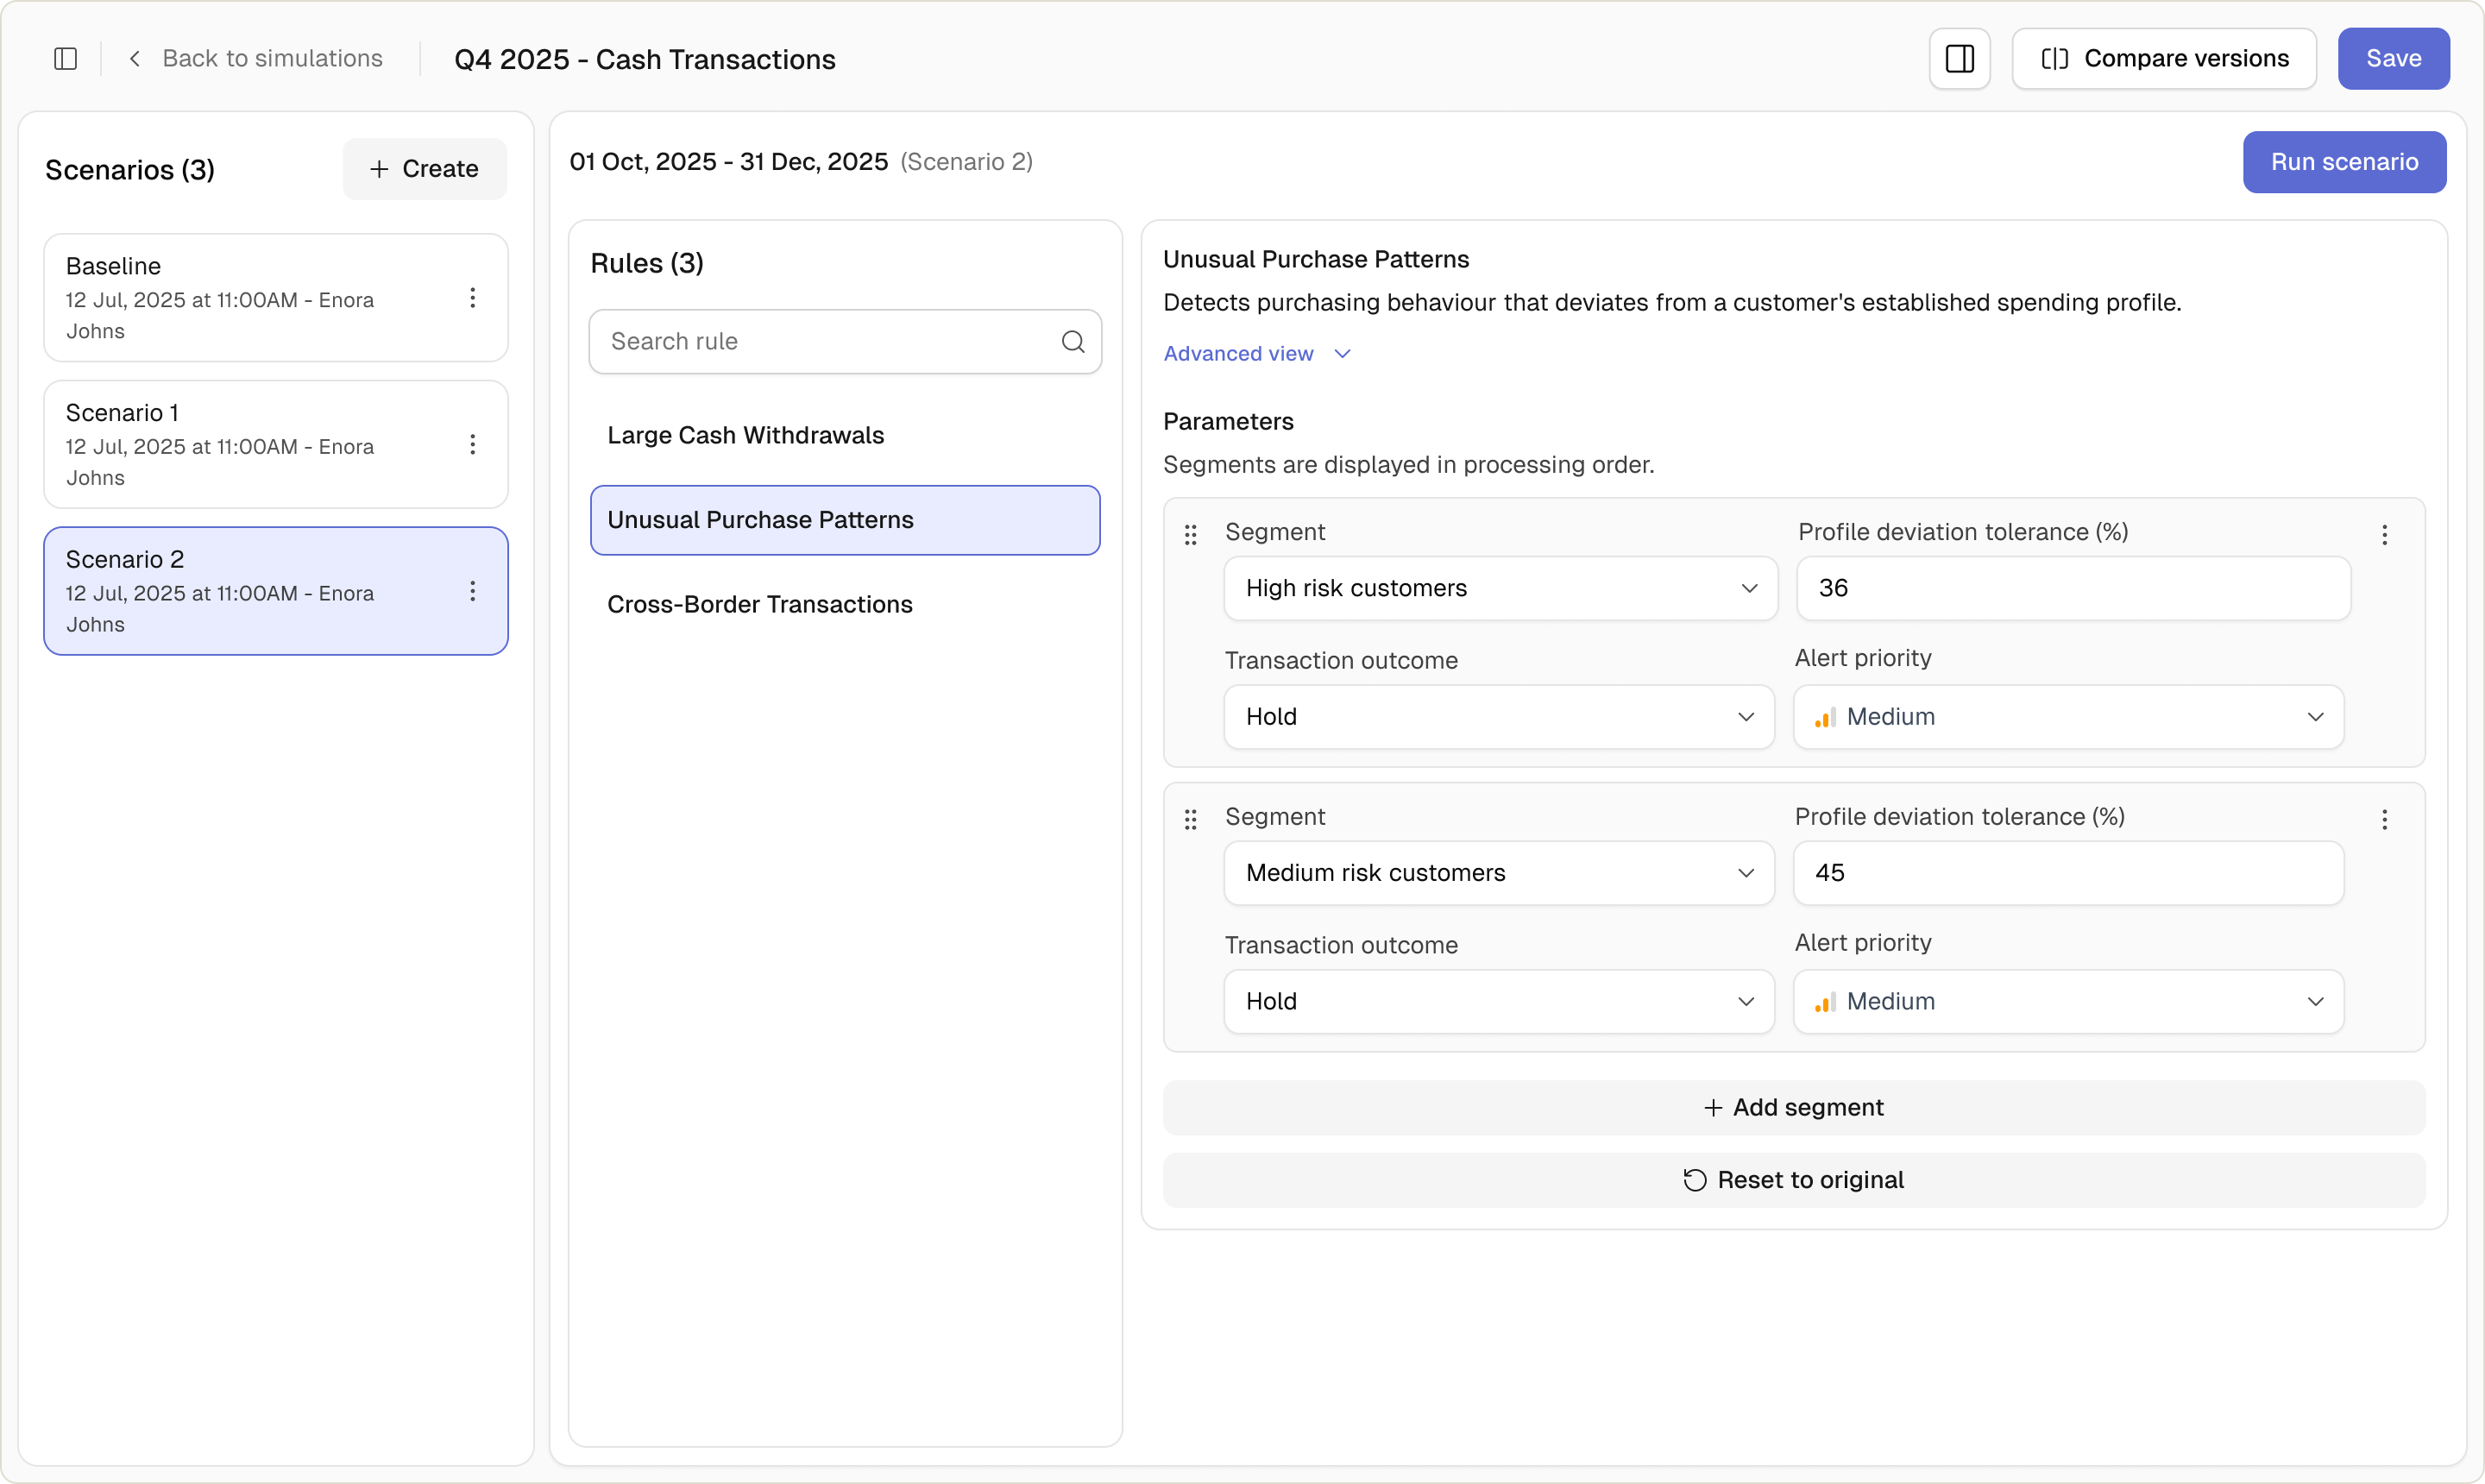
Editing rule segments and parameters
Once the reference test is established, the next step for users is to create additional tests within the same simulation in order to compare them against this baseline or between each other.
For these tests, users can modify rule parameters to simulate alternative behaviours. This allows analysts to create intentional variations: increasing or decreasing thresholds, targeting specific customer segments, or testing how a rule performs when applied differently across those segments.
By isolating parameter and segmentation changes within individual tests, the system encourages structured experimentation. Each test becomes a variation of the same underlying dataset, making performance differences measurable and analytically meaningful.
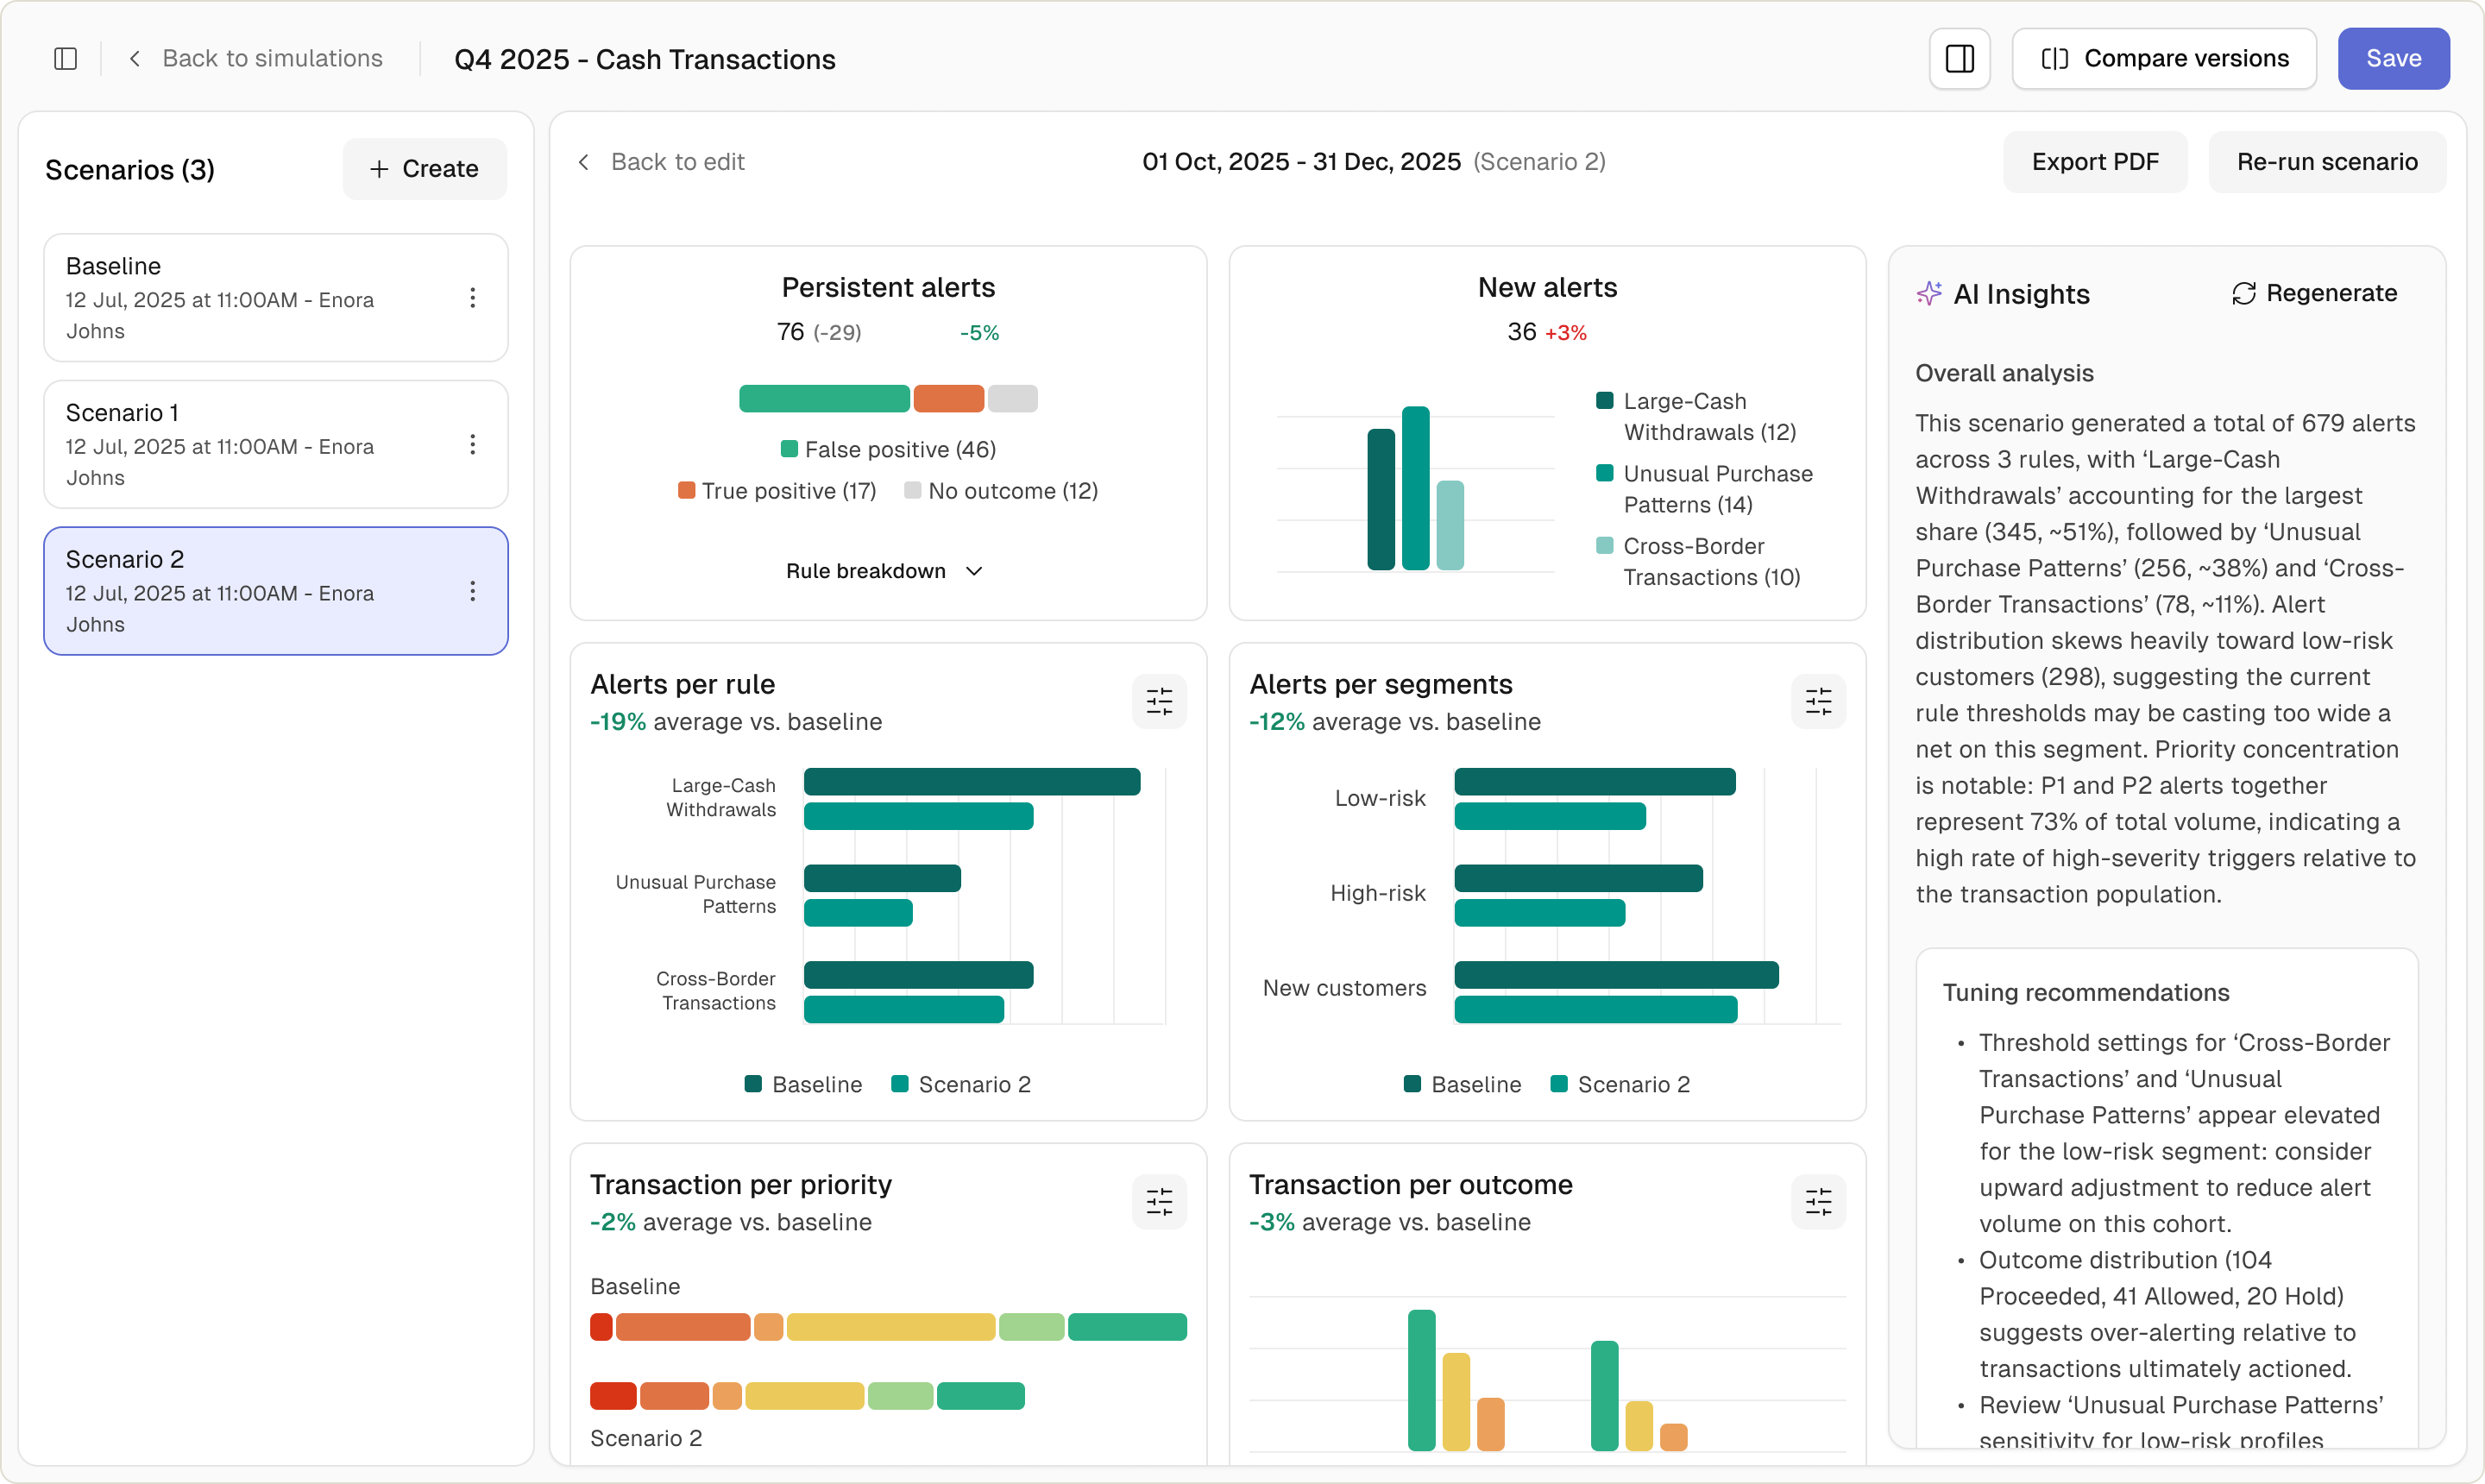
Interpreting results via a multi-layered overview
Once executed, tests generate a metrics dashboard. The dashboard surfaces multiple analytical dimensions:
- Alerts per rule to assess rule productivity
- Alerts per segment to understand distribution shifts
- Alerts per priority to evaluate risk allocation
- Transaction outcomes to quantify operational burden
- Time-series distribution to detect volatility or seasonal effects
The goal was to provide a coherent analytical narrative: volume, distribution, risk, and operational impact.
This metrics dashboard allows users to dynamically refine their analysis by editing filters for each graph, such as including or excluding specific rules and segments to isolate the drivers behind performance shifts. This makes it possible to move from high-level trends to focused investigation without leaving the dashboard.
Users can also choose to display the baseline delta, showing the difference between this test and the reference test directly within the visualisations. Instead of manually comparing values, analysts can immediately see where alert volume increased or decreased, and by how much.
Comparing simulations with two analytical modes
To support decision-making, the system provides two different comparison modes.
Side-by-side mode
Users can compare two simulations, often the reference test against a modified variation. Dashboards are displayed in parallel, enabling visual inspection of changes across key metrics. This supports qualitative analysis and rapid pattern recognition.
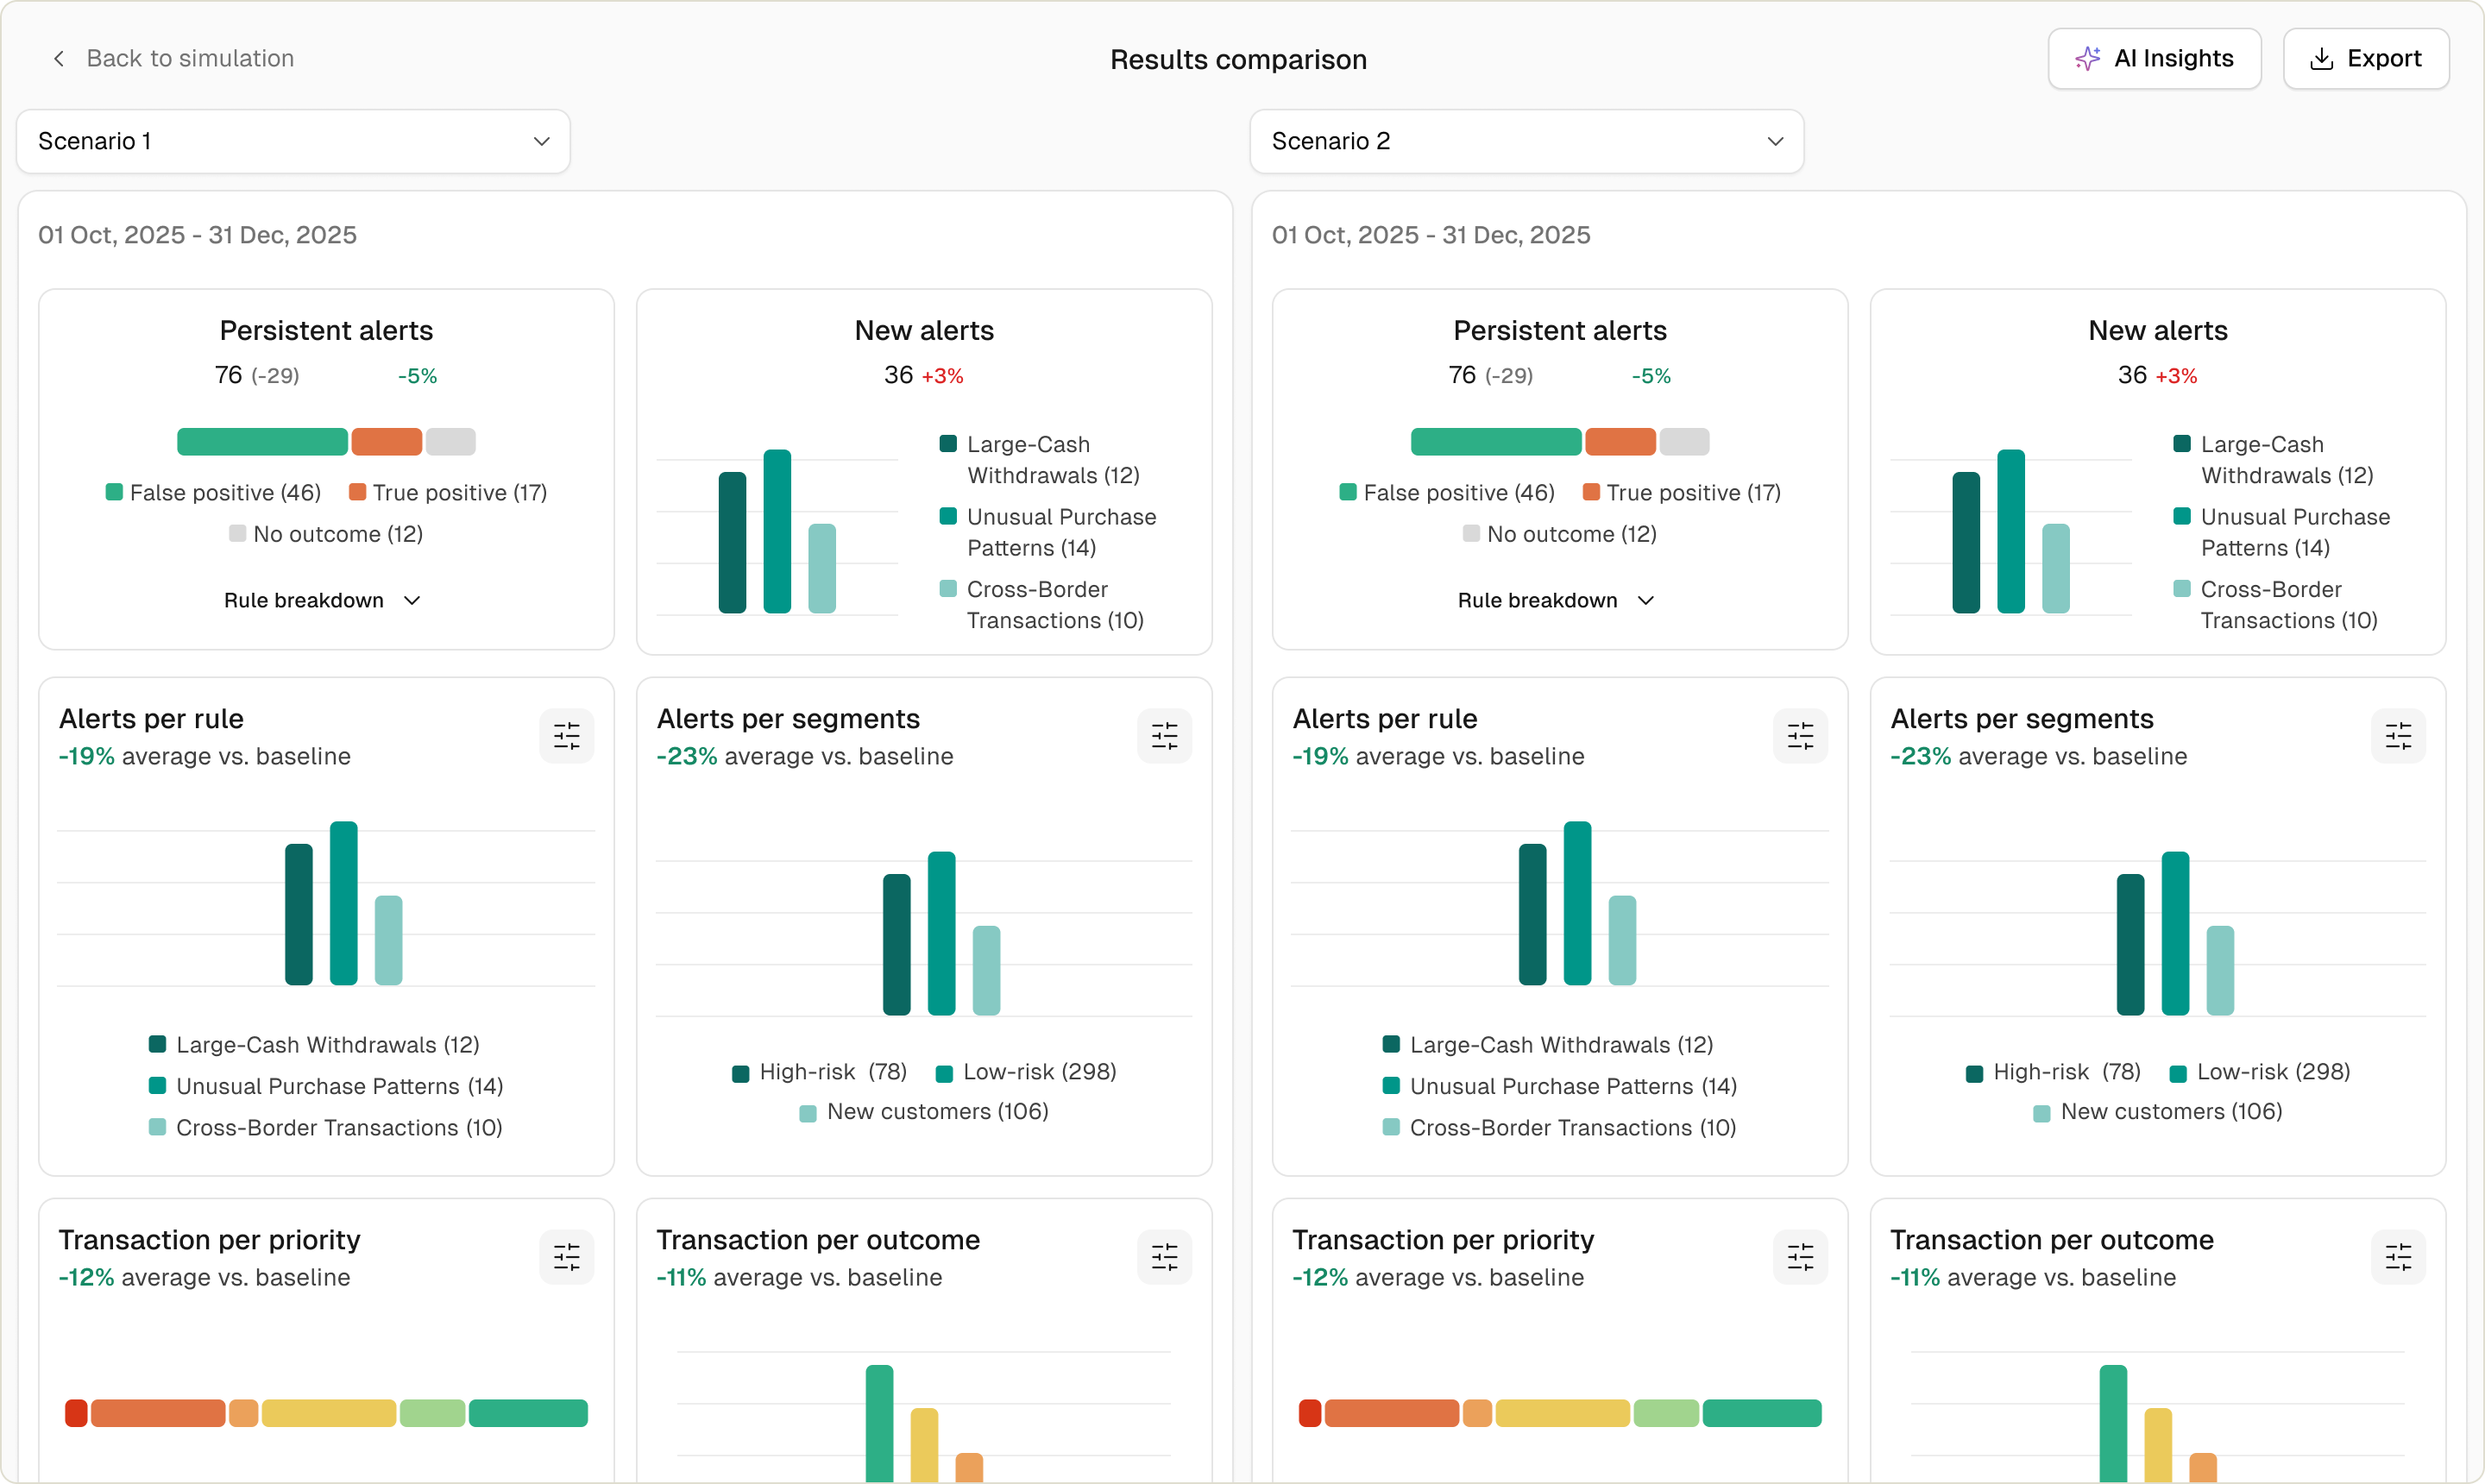
Table comparison mode
For deeper investigation, users can switch to a tabular comparison view. It enables sorting, filtering, and precise delta analysis, and is exportable in CSV format.
AI Insights to supporting analytical reasoning
An AI insights panel complements manual analysis by synthesising notable differences between the current test and the reference test. Rather than generating abstract comments, it gives tuning recommendations and focuses on:
- Significant alert volume changes
- Rules driving the largest variance
- Segment-level distribution shifts
This reduces analytical friction and helps users focus their attention on meaningful deviations.
Outcomes & impact
Because Mesh was still in early rollout, we validated outcomes with a small group of design partners: existing ComplyAdvantage clients currently using our legacy tool who agreed to test transaction monitoring in sandbox accounts using their own historical production data.
Within the first quarter of design partner testing:
- Design partners submitted ~40% fewer rule-change requests to the implementation team, as they were able to self-serve rule testing and iteration
- Rule-tuning cycles were faster, dropping from multi-day back-and-forth workflows to same-day iteration using simulations. Deployment time has been reduced by ~45%.
- After simulation-led tuning, partners identified configurations that would have resulted in 20–30% fewer alerts compared to their existing production rules
- Qualitative feedback showed increased confidence in explaining rule changes internally, particularly when preparing documentation for audits or regulatory reviews
Importantly, these metrics reflect decision confidence and operational efficiency, not confirmed financial crime outcomes. Simulation results are treated explicitly as proxies, aligned with how compliance teams already reason about rule effectiveness in practice.
In a nutshell
The final solution transforms rule testing into a structured experimentation environment:
- Clear testing methodologies
- A stable reference baseline
- Flexible rule configuration
- Multi-dimensional results analysis
- Comparative evaluation modes
- AI-assisted interpretation
Instead of exporting data to spreadsheets for comparison, compliance teams can run, compare, and interpret simulations directly within the product via a data-driven workflow.
Next steps would include:
- Introducing shadow testing, where configurations run silently in production without generating alerts
- Incorporating TM AI agent outcomes into simulations to better estimate false positives
- Enabling controlled promotion of simulation changes into production rules